

The latest data series on quarterly gross domestic product released by the ministry of statistics and programme implementation stretches across quarter one of the financial year 2011-12 through the first quarter of FY 17-18 and records quarterly GDPs for the period at constant 2011-12 prices. The quarterly GDPs for each financial year add up to the annual GDP and it is a simple exercise to calculate the approximate annual rate at which GDP had grown over the last three financial years. Given the debate surrounding the growth performance of the economy since the first quarter of FY 14 till current times, it is of interest to figure out what the average annual growth rate has been.
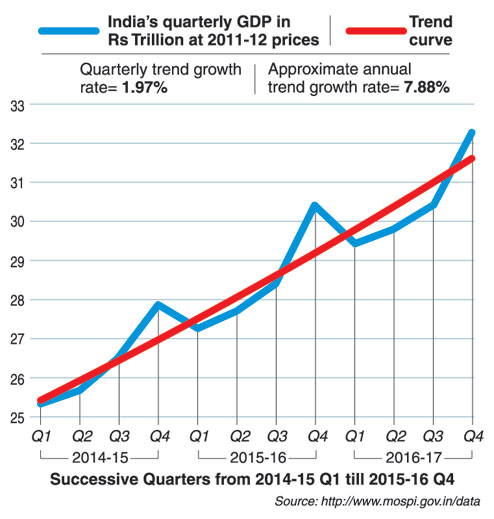
The diagram captures the calculation. The blue wiggling curve represents the quarterly GDPs for each quarter (in trillions of Indian rupees), starting from the first quarter of FY 14-15 till the end of the last quarter of FY 16-17. Suppose, however, that the GDPs were rising at a constant compound rate. Is there a constant rate that closely reflects the non-constant wobbly behaviour? The answer to the question is an unqualified "yes" and economists call it the trend rate of growth. The thick red curve in the diagram shows the path followed by the quarterly GDPs rising at the trend rate of growth. The quarterly trend growth rate turns out to be 1.97 per cent, so that the underlying annual rate of growth is (1.974=) 7.88 per cent approximately. Subtracting the estimated population growth rate of 1.2 per cent for this period, the average annual growth rate of per capita GDP for the period turns out to be 6.68 per cent.
Why is it important to calculate this best average annual growth rate? The answer can be found in a simple rule of thumb worked out by the Nobel laureate, Robert Lucas, of Chicago University. According to his formula, the GDP of an economy growing at a constant average rate of g per cent doubles every 70/g years. A similar observation applies to the per capita GDP. In the case of India, if the average growth rate of 7.88 per cent is sustained, then its GDP (at 2011-12) prices should double in (70/7.88=) 8.88 years, which is marginally less than nine years. Adding up the quarterly figures for FY 16-17, the annual GDP for that year is seen to be Rs 121.9 trillion. Thus, if India's GDP continues to grow at an average rate of 7.88 per cent, the GDP will rise to Rs 243.8 trillion by FY 24-26.
Further, during 2016, India's population stood at an estimated value of 1.32 billion (or, 0.00132 trillion). Thus, its per capita GDP was roughly Rs 121.9/0.00132, or, Rs 92,348.48. With per capita GDP growing at the rate of 6.68 per cent, the Lucas formula predicts that it should double in 70/6.68, or, approximately, 10.5 years. Thus, if the annual per capita GDP growth remains stable, then around FY 25-26, the per capita GDP will stand at Rs 1,84,697 approximately. Assuming an American dollar-Indian rupee exchange rate of Rs 60 per dollar, the per capita GDP in FY 25-26 should be $3,078. If the exchange rate behaves more favourably for India, then the Indian per capita GDP, expressed in US dollars, will be higher. The per capita figures will double further in the next 10.5 years and so on. In 30 years or so, starting FY 15-16, India's per capita GDP should be of the order of $12,000 or so.
A number of caveats are in order here. First, the calculations are made at 2011-12 prices. Over time, prices might rise and make the real GDP significantly smaller than what the above calculation suggests. Second, exchange rates are known to be volatile. Hence, the quoted US dollar equivalent may not be cause for too much euphoria. Then, a high per capita real GDP indicates little about the distribution of the GDP across the population. Inequality of income distribution is a major problem for India. Also, since India is being flaunted as China's close competitor, it is worth taking note of China's per capita GDP for 2016. World Bank figures indicate that this was $6894.50 and China too is growing. Where China will stand in 2025 is anybody's guess, but it is safe to assume that India will not catch up with China in the next 10 or 20 years. Finally, the calculations are based on the assumption that the average annual rates of growth will remain stable.
It is the last mentioned issue that has been the subject of hype in recent months, especially since the demonetization exercise was carried out by the government. Common sense as well as short term economic modelling suggest that demonetization will have a contractionary impact on the economy. Expenditures are likely to be curtailed in particular, leading to shrinking sales and hence a lower GDP growth rate. However, what was in fact the impact of demonetization on the trend growth rate calculated above? To answer this question, one needs to calculate the trend growth rate as it prevailed prior to demonetization, that is, till the second quarter of FY 15-16. Following the technique utilized by the diagram above, the annual trend growth rate for GDP was 7.72 per cent till the second quarter of FY 15-16. Then, in the third quarter, when the policy was actually implemented, the rate fell to 7.4 per cent. This fall was temporary at best, since, as the diagram shows, the growth rate rose up to 7.88 per cent by the end of the year.
The MOSPI data includes the first quarter of FY 17-18 and if this quarter too is factored in, the annual trend rate falls once again to 7.4 per cent. Since the annual growth rate picked up soon after demonetization, the fall brought about by the first quarter of FY 17-18 calls for an explanation. The answer is unlikely to be found in the implementation of the goods and services tax, for the latter came into force in July 1 of FY 17-18, which is beyond the first quarter of the year. There could be a whole lot of explanations, including the performance of the export sector and there is no point hazarding a guess at this point of time.
Of course, India's annual growth rate figures cannot be brushed off either. The average annual growth rates of per capita GDP for the far eastern miracle economies (Hong Kong, Singapore, Taiwan and South Korea) hovered around 5-6 per cent during 1960 through 1997. In this 27-year period they had been able to reach per capita GDP values in the range of $10,000-18,000. India's annual growth rate of per capita GDP, as we saw, has well exceeded the miracle figures. If the population growth rate turns lower and the average annual growth rate of GDP does not falter too much, as it has not till now, India's per capita GDP too may prosper significantly in the next decade or two.
Demonetization did cause human misery in the short run, but it does not seem to portend any long-term economic damage. Having criticized the policy in the past, this columnist believes at least that there is scope yet for revisiting the issue.
The author is former Professor of Economics, Indian Statistical Institute, Calcutta