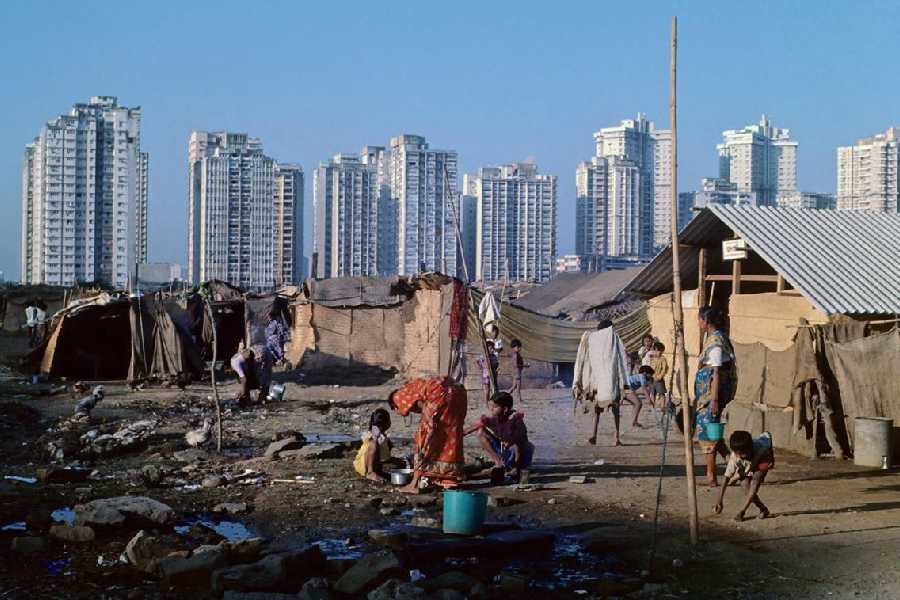
Is India becoming more equal? A recent government communication drew attention to India’s advancing reductions in poverty and inequality citing the World Bank’s latest Poverty and Equity Brief update. The specific pointer was to the Gini index, a measure on a 0-100 scale with leftward movements indicating lessening inequality. This score declined to 25.5 from 28.8 between 2011-12 and 2022-23, ranking India fourth in the world in income equality.
At the outset, we must note that India’s measure is based on consumption expenditure; so it is consumption inequality that recorded a fall. Extreme poverty in the same period fell to 2.3% from 16.2%, with 171 million persons crossing the threshold of $2.15 per day. The international agency tracks these two trends biannually for over 100 countries each year.
Both provide valuable insights into India’s development trajectory that ought to be moving in the observed directions. The decline in extremely poor persons, for instance, has been eightfold in a little over a decade. That said, there are distinctions that merit careful understanding for nuanced and better insights.
Let’s begin with poverty. Advancing growth lifted India up into the lower-middle-income country group, the relevant poverty line for which is $3.65 per day. With this bar, the World Bank estimates poverty declined to 28.1% from 61.8% in the abovesaid period and 378 million people crossed over. More recent revisions to the international poverty lines using 2021 purchase parity prices by the body marked up this line to $4.20 per day this June, placing India’s poverty rate at 23.89% from 57.68% before. Corresponding adjustments to the extreme poverty line, now $3.00 per day from $2.15 before, show a respective decline to 5.3% in 2022-23 from 27.12% earlier. The other change for India — alignment of the older, 2011-12 household expenditure survey with a new and substantially different one in 2022-23 — is limited and the two cannot be fully compatible for various reasons, according to the World Bank. This, in turn, results in limited comparison over time.
Inequality is more contentious. It must be emphasised that the Gini score is measuring consumption, which the World Bank’s qualifier also points to. This does not directly use household incomes, data for which are non-existent. There are several reasons for this. Income data are typically secured from tax records and direct surveys, which do not happen in India (although a recent initiative for household income survey has been announced). Then too, income surveys are riddled with difficulties like underreporting tendencies of surveyed individuals, the exclusion of wealth, which is a significant source of persistent inequality that perpetuates for generations, and, particularly in developing countries, a narrow tax base, weak reporting systems, and the presence of a significant informal sector.
As such, the claim of reduced income inequality does not represent any betterment in the equalisation of earnings, nor does it indicate an upgradation in economic capacity. What the improved Gini score does reflect is progress in living standards or economic well-being, which is a positive development. The other aspect to note here is that consumption-based Ginis are routinely lower than income-based ones; this has been historically observed across countries and over time. The World Bank also caveats this, saying “inequality may be underestimated due to data limitations.”
A reflection of this is found in the opposing movements of income and consumption inequality. The World Bank alludes to the contrasting picture in this regard, referring to the World Inequality Database, which uses income and wealth data sourced from national accounts, surveys, tax records and wealth rankings to track the bottom-to-top evolution of income and wealth levels across countries for long periods for comparisons. These estimates show income inequality in India rose between 2004 and 2023, the Gini rising from 52 to 62 in these decades. Wage inequality remains high: in 2023-24, the top 10%’s median earnings exceeded those of the bottom 10% by 13 times!
The divergence in consumption and income-based inequality measures is explicable. An important reason why consumption expenditure-based scores understate inequality is that richer persons save proportionately more of their incomes; poorer ones have relatively larger propensity to consume their disposable incomes. The well-off typically do not participate in these surveys, so inadequate capturing of households at the top of the distribution depresses their consumption. Savings drawdowns, borrowings, and transfers, including public welfare, remittances and family support, also make consumption appear less unequal. Other factors relate to adjustments and exclusions; for instance, housing services use values for durable goods and flow of services and so on. All these lead to an overall underestimation of consumption inequality.
It is intuitively expected that expenditure inequality will tend to be lower than income inequality and its trend will be flatter over time. However, gaps in the two kinds of inequality are observed elsewhere too. The patterns are heterogeneous across developed and developing countries. For instance, many Latin American countries have seen decreases in both kinds of inequality unlike South Asian and African regions. Income inequality has risen significantly in the United States of America and some European countries while consumption inequality has generally remained stable — trends have varied due to macroeconomic shocks (such as the 2008 financial crisis), considerable wealth accumulation, and the important role of consumption smoothing with income fluctuations (borrowing when income declines and saving more with increases). In developed countries, income-based Gini suffices as the main inequality indicator because of robust income reporting unlike other groups.
China, an upper-middle-income country, offers an interesting contrast with India. Both types of inequality are similar in China, the gaps between the two narrowed as income inequality declined after 2008. Comparative research finds that expenditure inequality is higher in China than in India but income inequality much lower. The markedly higher income inequality in India reflects more concentration than expenditure, especially at the top of the distribution.
The perspective gained is that inferences of income inequality from consumption-based measures must be cautious. Neither tells the whole story but both provide valuable insights. Many researchers emphasise that there’s enhanced worth in examining the joint distribution of income and consumption to understand the evolution of economic well-being rather than choosing one over another.
Renu Kohli is a macroeconomist and former staff, RBI and IMF. Views are personal


