

Soothsayers, unsupported rumours and muscle-flexing politicians' incriminations and counter-incriminations notwithstanding, it is literally impossible to predict the future course of the West Bengal economy, or any other economy for that matter. However, a few key indicators of the economy's performance over the past are easy enough to locate, given a rich Reserve Bank of India data source, supplemented by publications of the ministry of commerce and industry.
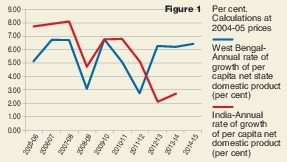
Where should we begin? However inaccurate the concept may be as far as its welfare implications go, few would ignore the per capita output tale. Let us start off, then, with the per capita net state domestic product. A per capita figure, as is well-known, hides elements of inequality. Nonetheless, it is one variable whose growth over time, corrected for price inflation, often correlates with the state of an economy's health. The first diagram reveals how the annual growth rates of per capita or average production have behaved in the West Bengal economy from the financial year 2005-06 through 2014-15 vis-à-vis that of India as a whole.
The graph provides food for thought. The annual rate of growth of per capita NSDP in West Bengal had dropped down to as low a value as 3.05 per cent in 2008-09, probably on account of the sub-prime crisis in the United States of America. One could explain this drop by the exit of the Tatas as well, but the explanation may be questioned, since the behaviour of the superimposed all-India picture is no different. In fact, the annual rate climbed up to 5.08 per cent during the last year of Left Front rule, raising serious doubts about the damage done to the West Bengal economy by the departure of the Tatas. Of course, there was a sharp drop to 2.71 per cent in the first year of the new government, but the all-India rate of growth collapsed to 2.12 per cent next year when West Bengal climbed up to a growth rate of 6.26 per cent and subsequently to 6.42 per cent in 2014-15. A puzzle could well be lurking here, for the present government's "poor image" theory runs contrary to the phenomenon of its per capita NSDP growth rate overtaking the all-India rate for most of its tenure. As far as this fact is concerned, West Bengal's recent performance has remained well within the comfort zone.
The total NSDP, of course, subdivides into sectors. And the agricultural sector by contrast has a less heart-warming story to offer. Over the period 2004-05 through 2010-11, agricultural growth had gone through fluctuations. It had risen to a dizzying height of 8.33 per cent in 2009-10, but also tumbled down to (-) 4.01 per cent in 2008-09. By comparison, the highest growth rate achieved by the new government was 3.21 per cent in 2012-13 and it ended up with a meagre 1.5 per cent in 2014-15, which was lower than the growth rate during the year 2005-06 achieved by its predecessor. Quite likely, agriculture has not flourished under the new regime, though it was in the interest of the farmer that the Singur incidents occurred. On the other hand, the corresponding figures for India as a whole have been disappointing as well. As opposed to West Bengal's growth rate of 3.21, 1.43 and 1.5 respectively during 2012-13 through 2014-15, India's rates were 1.19, 3.66 and 0.23. In other words, whatever the reason for unimpressive growth in agriculture might have been, West Bengal's performance simply mirrored the all-India picture.
And that brings us to the manufacturing sector, the sector that has been of singular concern since the Tatas left. The story of manufacture subdivides into the so-called registered and unregistered sectors, which, loosely speaking, may be identified with the organized and the unorganized sectors.
Leaving aside rates of growth, what have been the levels of production of the registered and unregistered sectors during the period of discussion? In spite of fluctuations, manufacture has shown an upward trend, but during both political regimes, it is unregistered manufacturing that has occupied the driver's seat. A great deal has been written about the indolence of registered manufacture, even if its nature has refused to change. But a story within the story emerges as one analyses the growth rate figures once again.
First, there was a fall in registered manufacturing in 2008-09, which, as in the case of per capita output, can be explained with reference to the sub-prime crisis and not the exit of the Tatas. Indeed, post 2008-09, registered industry jumped once again to a level exceeding 14 per cent. This might appear strange, but may not really be so. Registered industrial growth had risen to a level of 18.08 per cent as early as 2006-07, perhaps in response to the Tatas' decision to set up the Singur factory. On the other hand, it rose once again to 15.67 per cent after the Tatas left, possibly since the producers the Tatas had attracted back in 2006 itself were still operative. In other words, registered industrial growth reached high rates towards the tail-end of the Left Front regime, although the Tatas had not contributed to the production flow directly. It is tempting to conclude that it was Left Front industrial policy that had energized the growth wise industrial performance in West Bengal.
A second factor that stands out clearly in this context is that, except for 2008-09, the rate of growth of registered manufacture had been consistently higher than that of unregistered manufacture, a picture that has dramatically changed since 2011-12. The rate of growth of registered manufacturing fell down to (-) 17.47 per cent in 2011-12, although in the immediately preceding year the rate was a post Tata 14.6 per cent. What explains this behaviour of registered industry requires further research, but it is unlikely that the Nano disaster would be a major explanatory factor.
The government has been engaged in attracting investment for industrialization in West Bengal. According to the data published by the ministry of commerce and industry, while Rs 3,747 crore worth of new investment was implemented in West Bengal in 2014, Gujarat attracted Rs 40,954 crore. Gujarat accounted for 52 per cent of new investment, while West Bengal stands at 5 per cent and even less in the preceding years. Further, it is interesting to note that Orissa had ended up higher with an actual investment figure of Rs. 7,521 crore. How far new investment is flowing towards West Bengal is therefore a question worth pondering over.
As pointed out at the very beginning, the disappointing performance of the agricultural and the industrial sectors notwithstanding, the per capita net output performance has been reasonably satisfactory for West Bengal. This appears to suggest that the service sector has been a saviour. For example, the sector comprising real estate, ownership of dwellings and business services posited a growth rate of 9.66 per cent in 2013-14 and 10.6 per cent in 2014-15. Banking and insurance registered growth rates of approximately 13.46 per cent during these same years. Strangely enough though, the growth rate in the trade, hotels and restaurant sector fell to 2.46 per cent in 2014-15 from 5.25 per cent in 2013-14.
Apart from the per capita NSDP, the state has successfully handled its debt liabilities too. According to the budget estimates for 2015, its aggregate debt has been brought down to 35 per cent of its gross SDP. This is an achievement worth noting, since it began with the burden of 41.9 per cent in 2011.
Should these macroeconomic figures matter, now that the assembly elections are knocking on our doors? The answer is not too clear, since political scientists appear to concentrate on political swings alone to make future predictions. And that surely is a misfortune. However dismal the science, economics ought to matter as well.
The author is former professor of economics,
Indian Statistical Institute, Calcutta