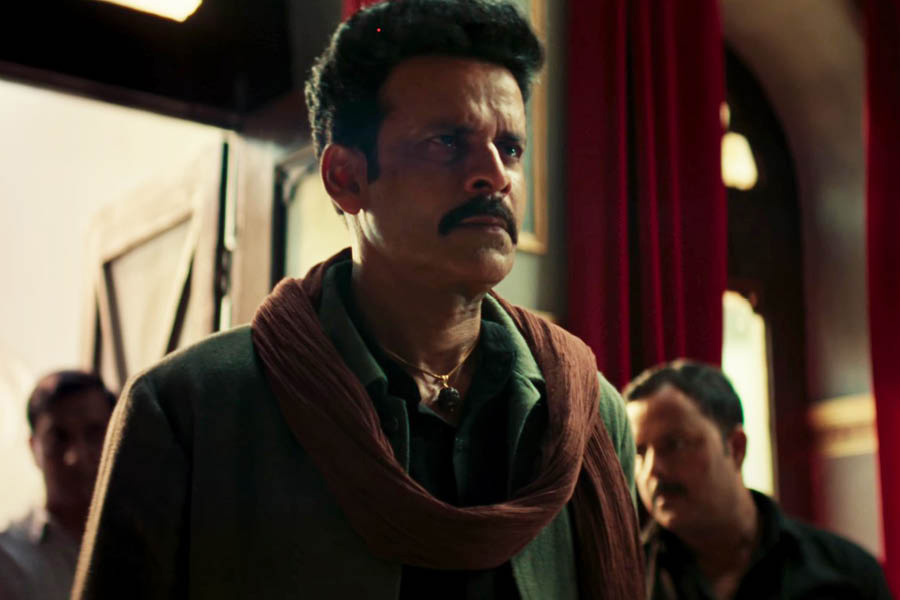


Finally, ‘The Family Man’ S3 is in production!
Deepika’s ‘Piku’ throwback will make you misty eyed
This English dub of ‘What Jhumka?’ will make you giggle for sure
How about having some crunchy, munchy Bhel for breakfast?
Tune in to Iman Chakraborty’s song from the album ‘Boishakher Panch Gaan’
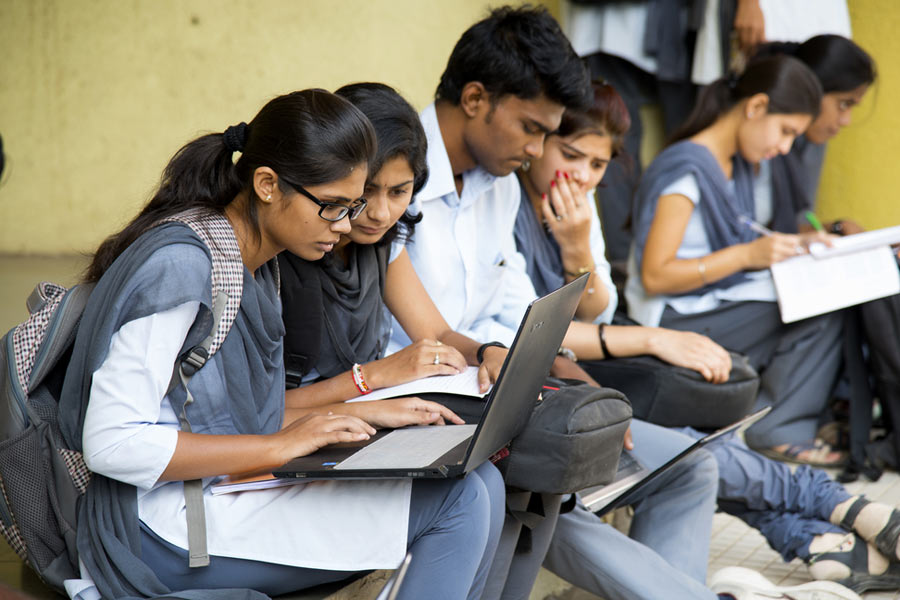
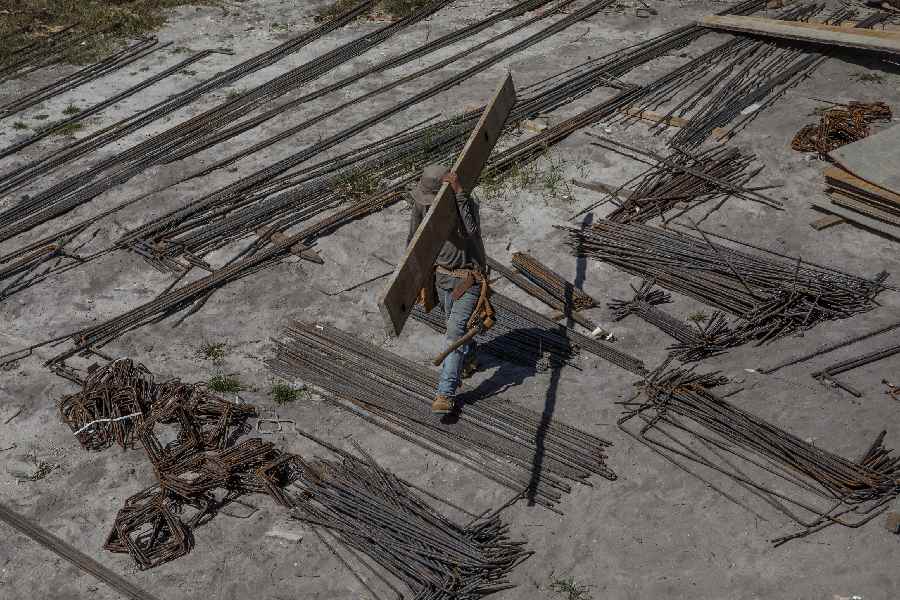
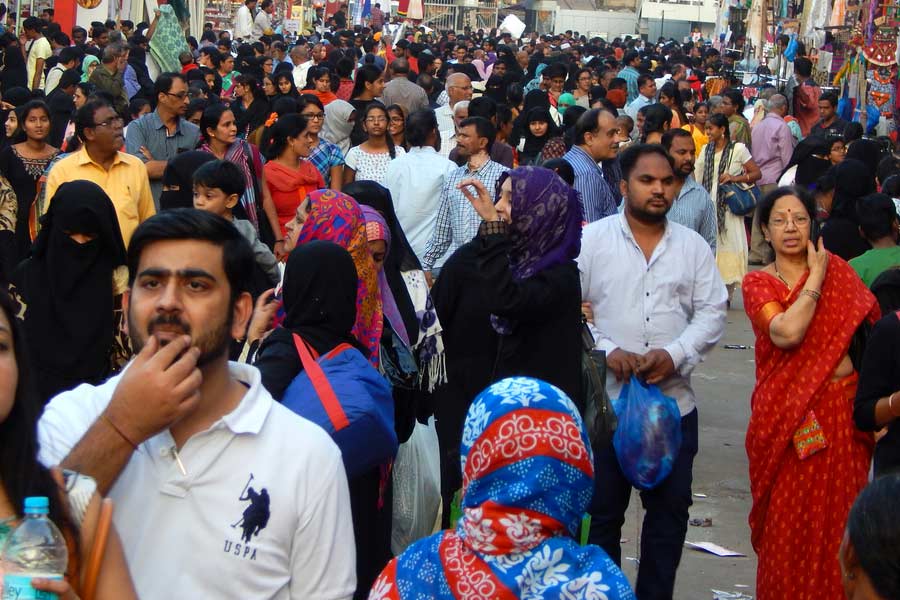
In India, there is another terrifying phenomenon now: millions are so fed up with looking for a job that they have stopped looking and have exited the workforce
R. RAJAGOPAL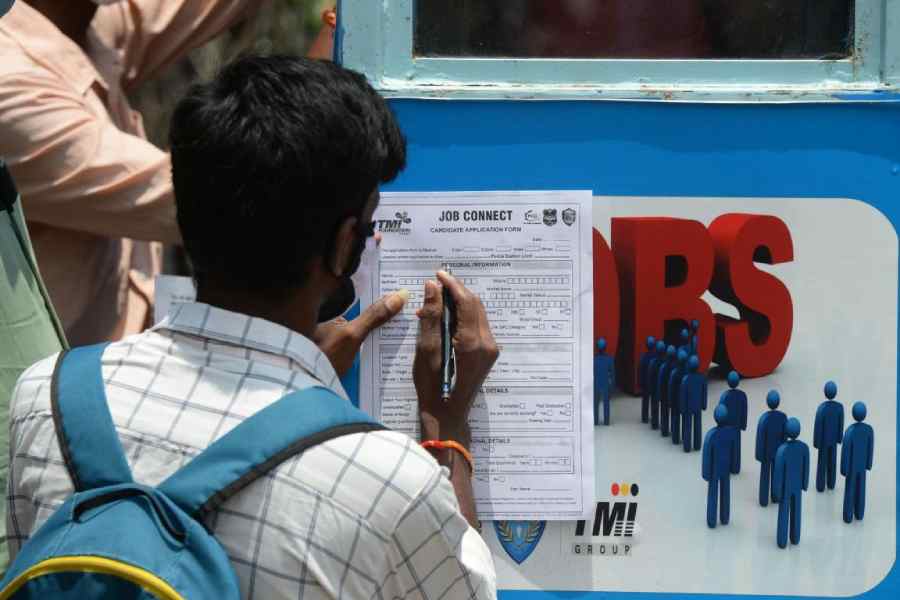
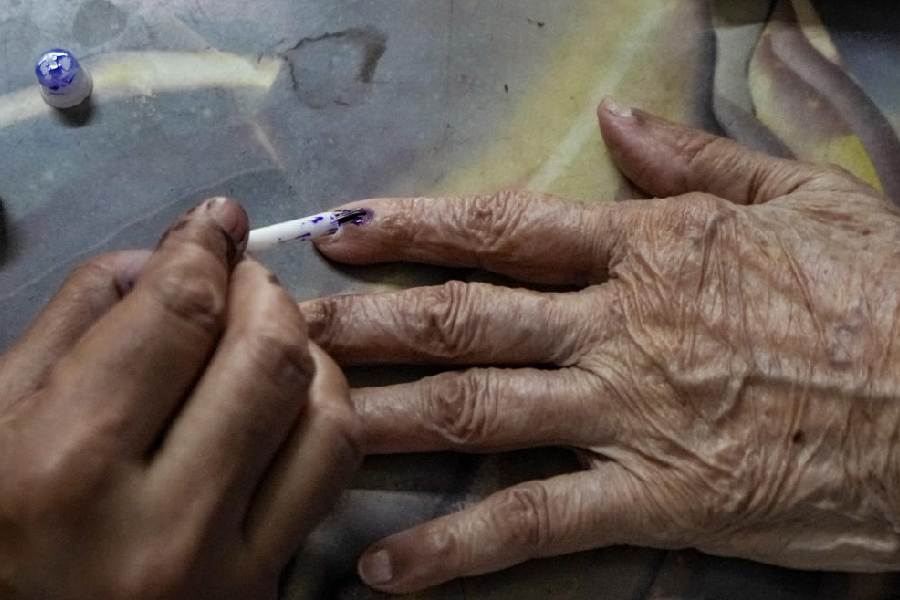
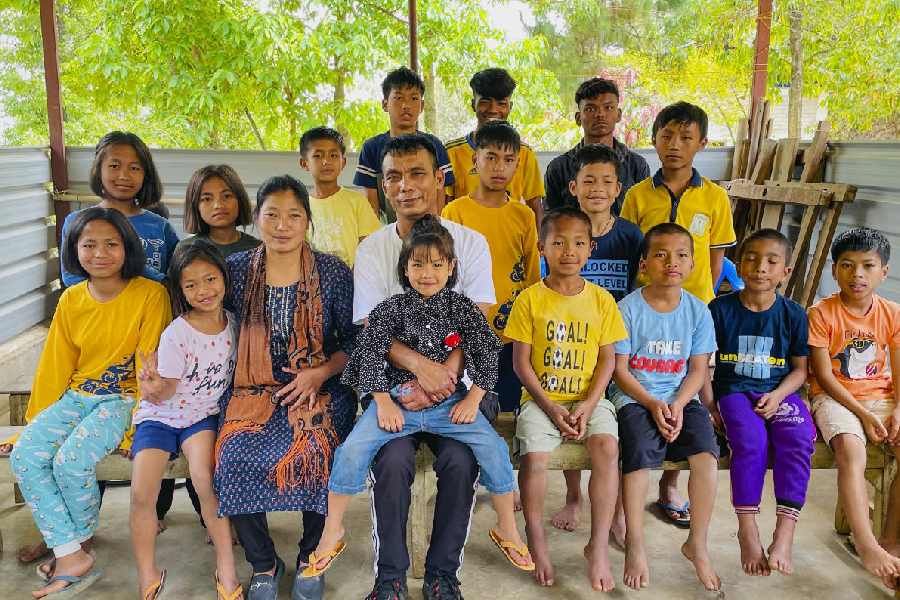
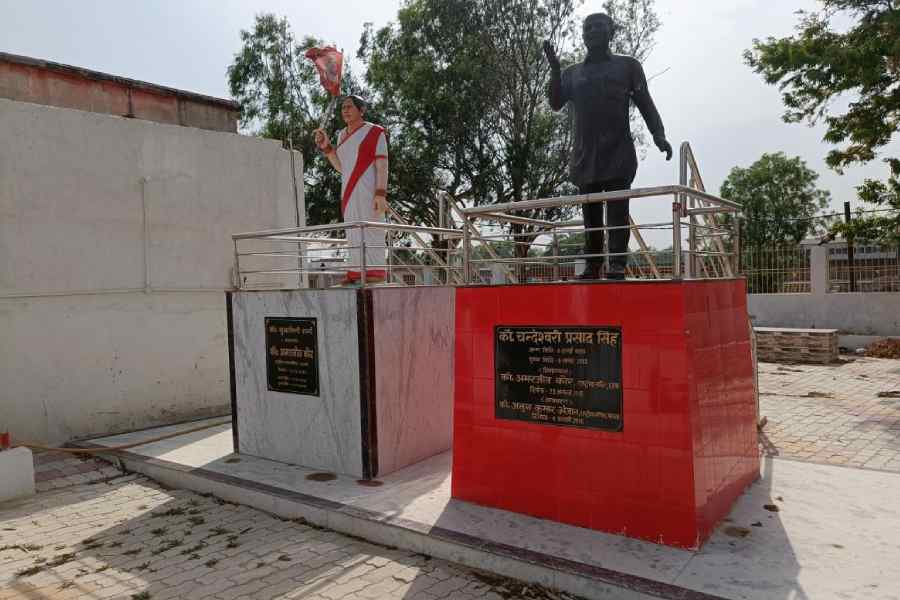
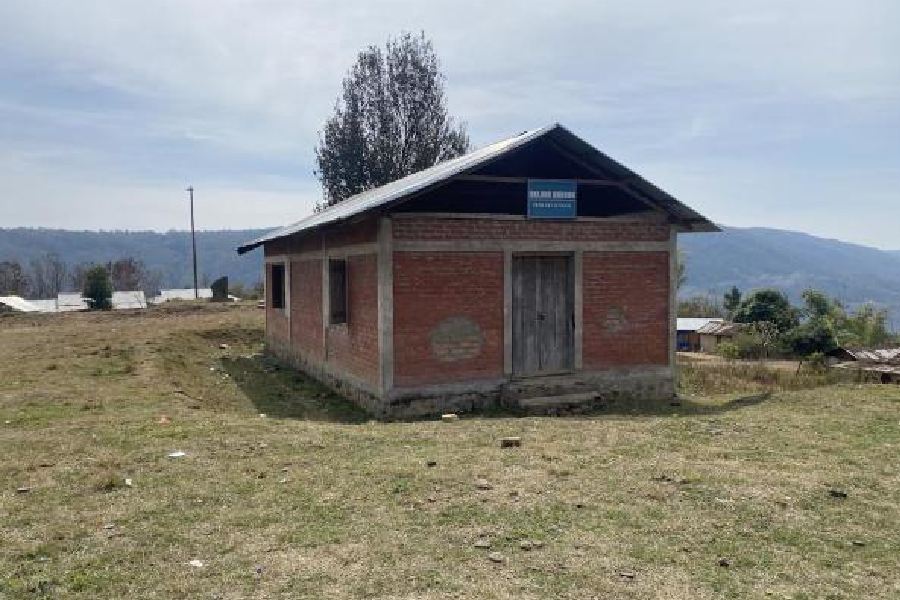
FRA seems to be a crucial issue in many constituencies — most acutely in states like Jharkhand, Madhya Pradesh and Odisha — that are going to the polls in the remaining phases of the elections
JAIDEEP HARDIKAR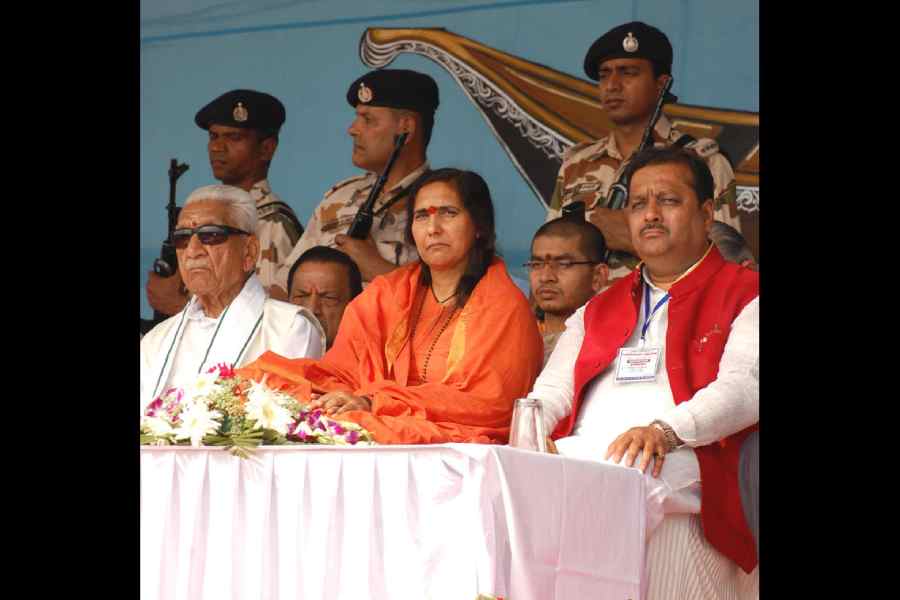
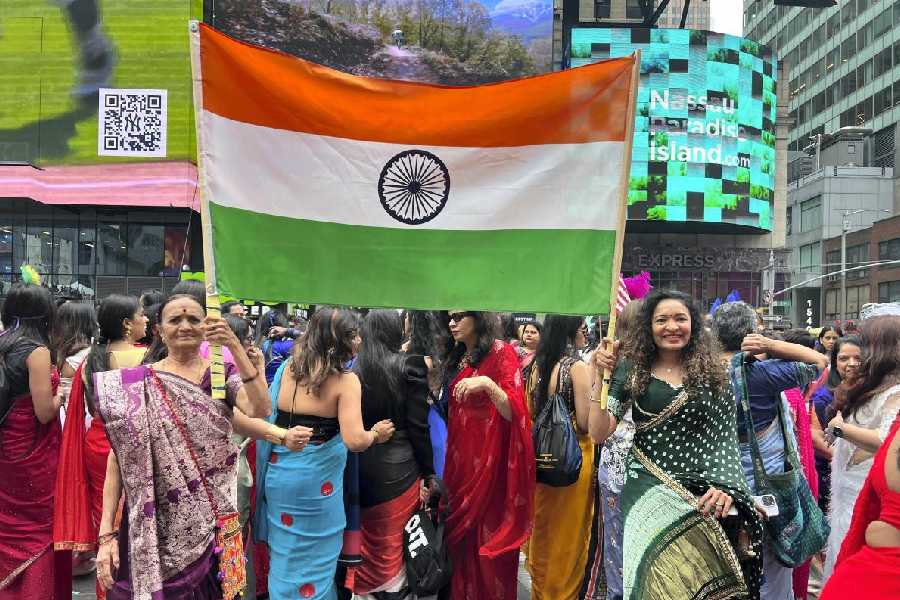
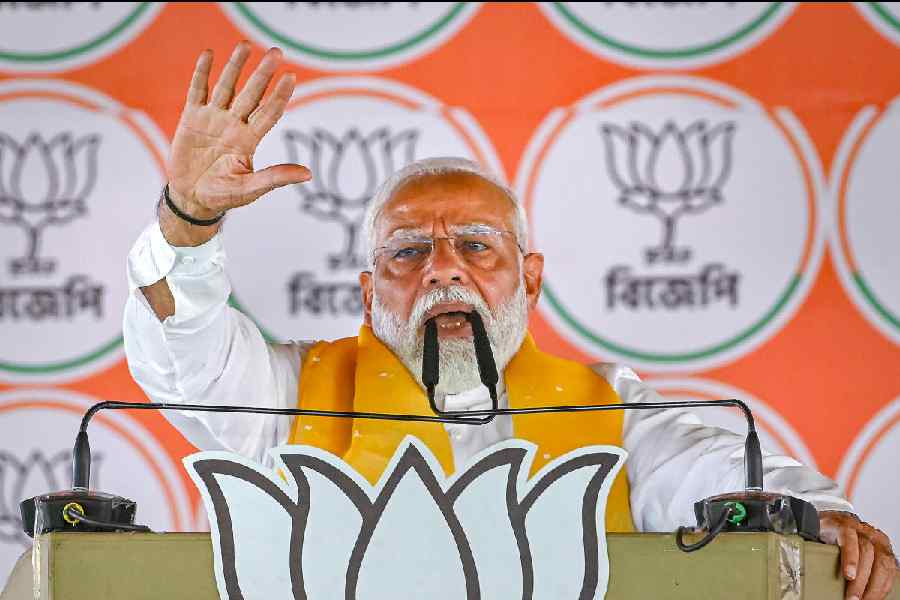
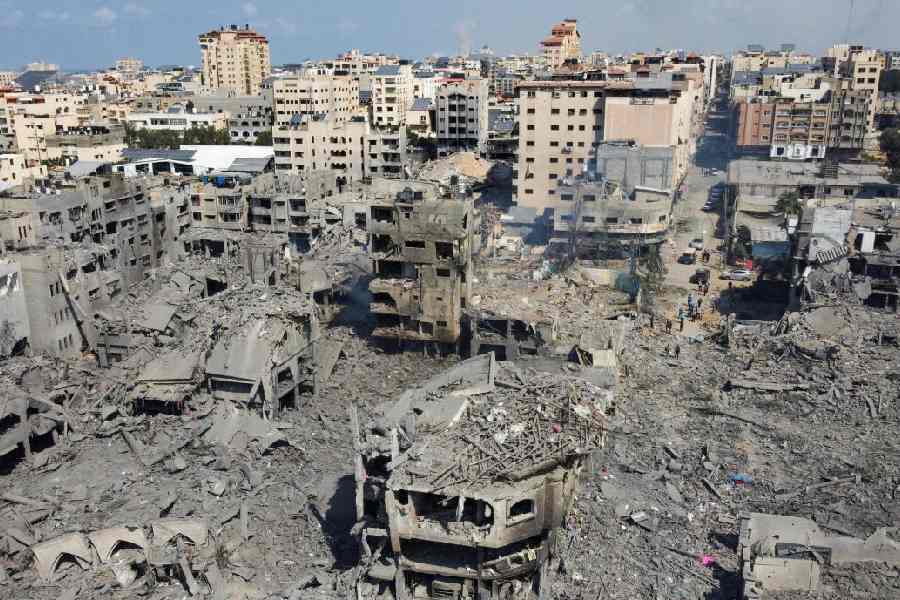
Intervening on social media, a chronicler of contemporary India recently complained that 'In fifty years of observing Indian elections I have never seen such vile and hate-filled rhetoric'
SWAPAN DASGUPTA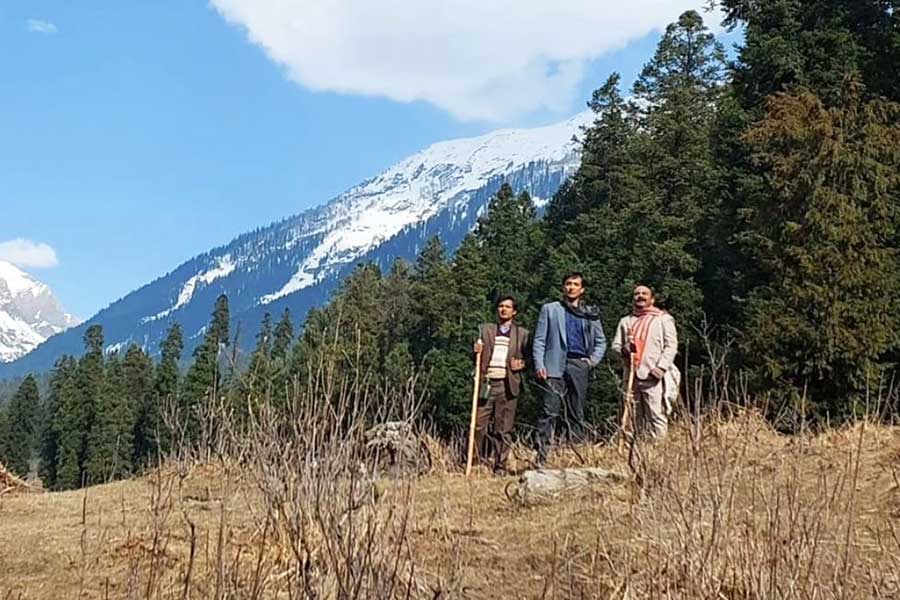
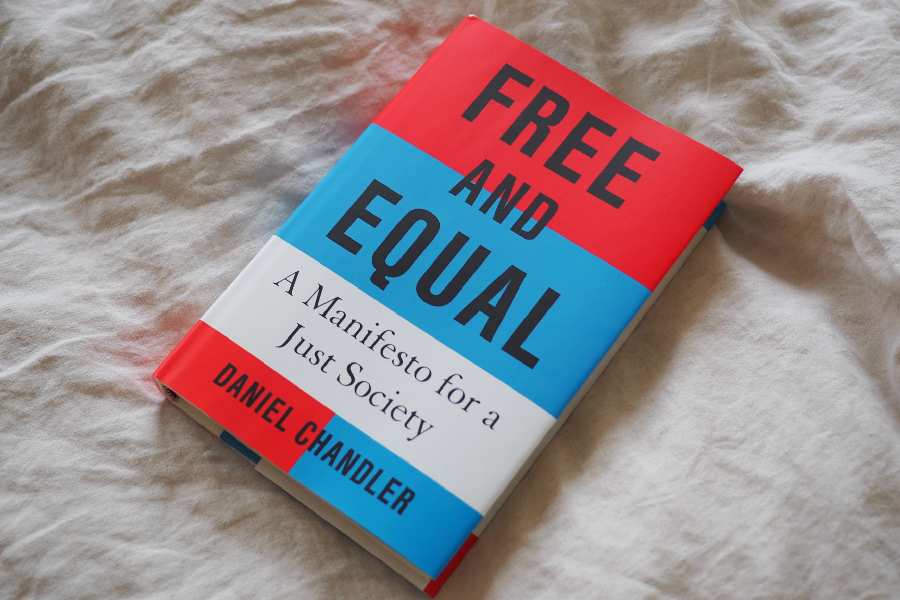
Travel writing was historically a lowbrow genre, both in terms of financial success & academic respectability, until two books appeared. One by Paul Theroux & the other by Paul Fussell
ABHISHEK CHATTERJEE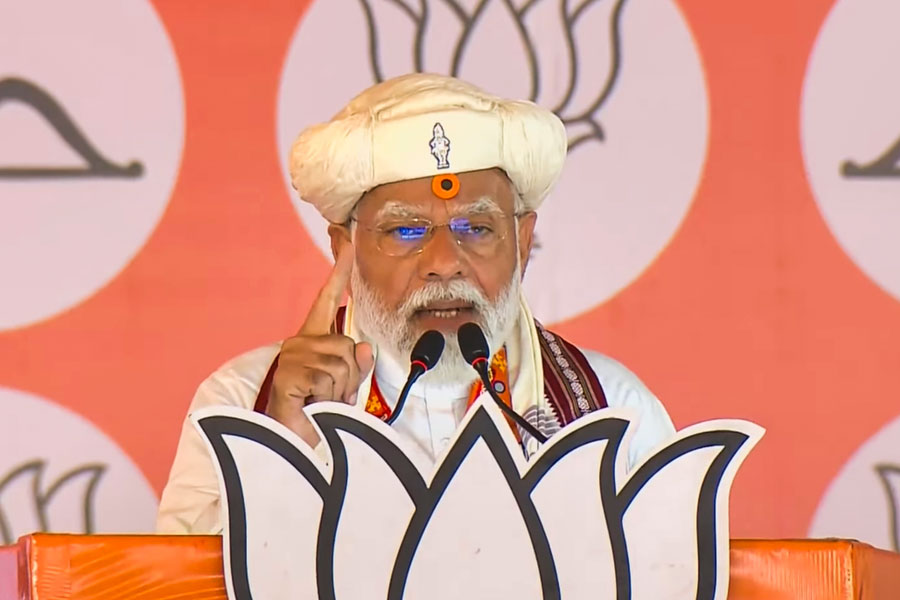
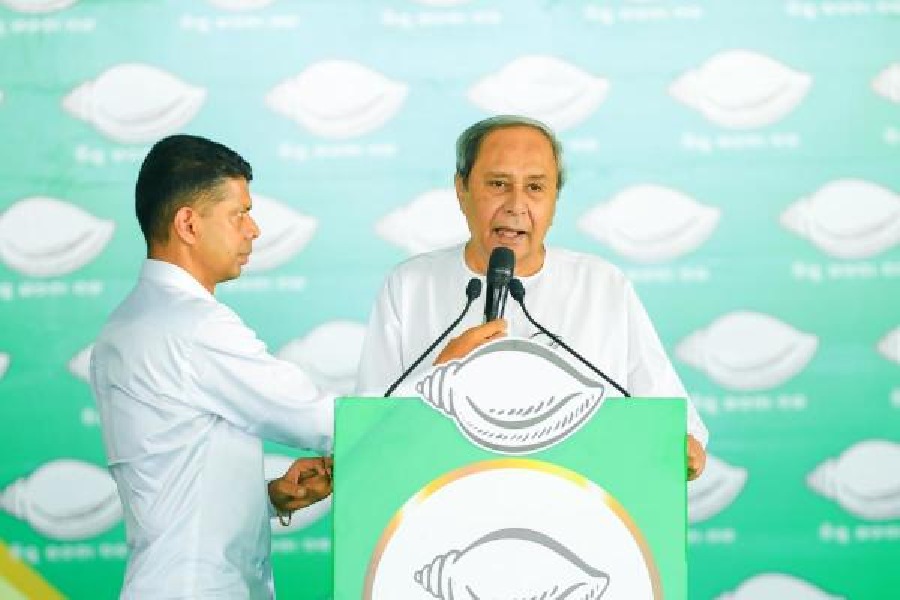
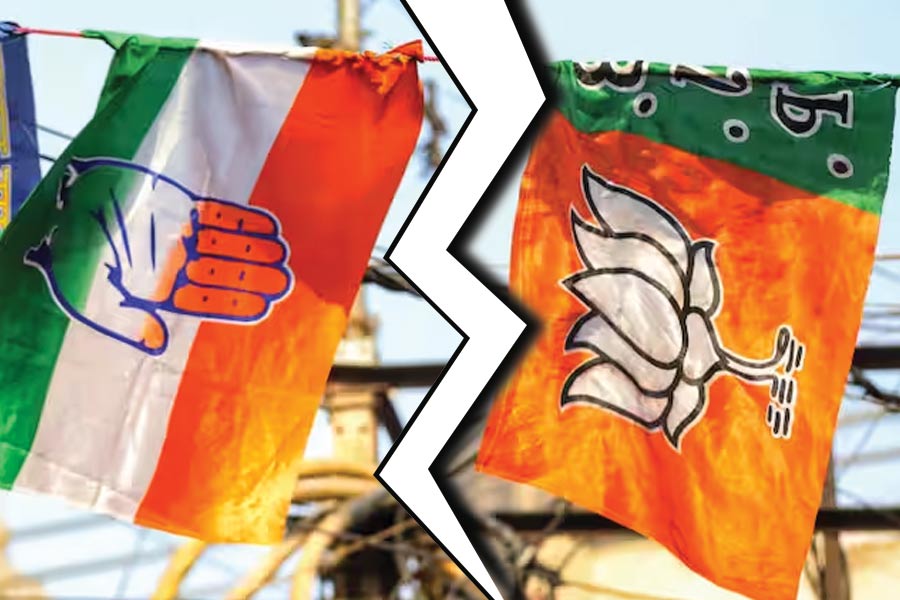
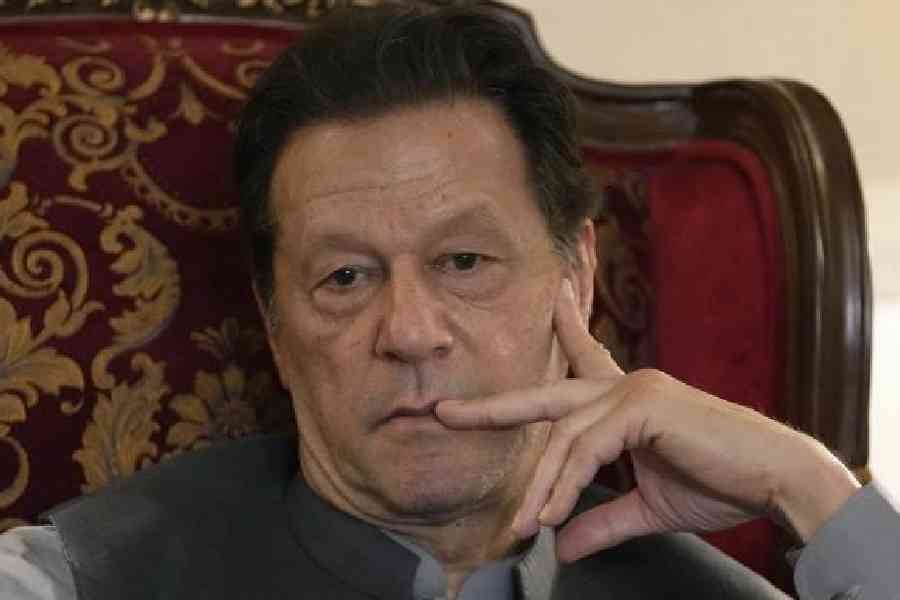
Mr Modi’s remark, however, reiterates an adage: that politics is shorn of permanent friends or foes. Yesterday’s patron — industrialist or otherwise — could well be today’s antagonist
THE EDITORIAL BOARD


Adapted from Andaleeb Wajid’s 2016 novel Asmara’s Summer, the series is directed by Debbie Rao and stars Anushka Sen in the lead role