


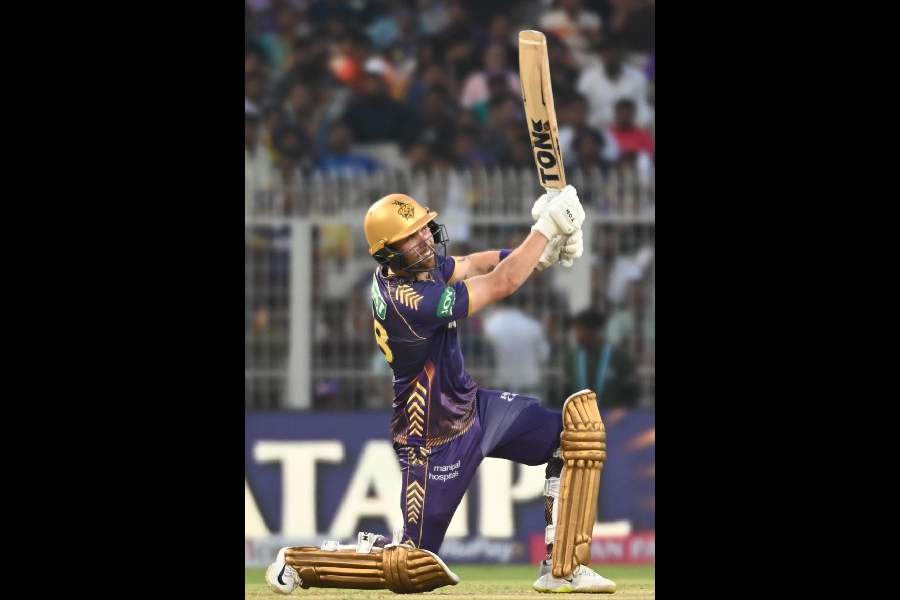
Does SRK’s speech to Team KKR echo a ‘Chak De! India’ moment?
Take notes from Ananya Panday’s Singapore trip
Dulquer Salmaan gave fans a perfect gift
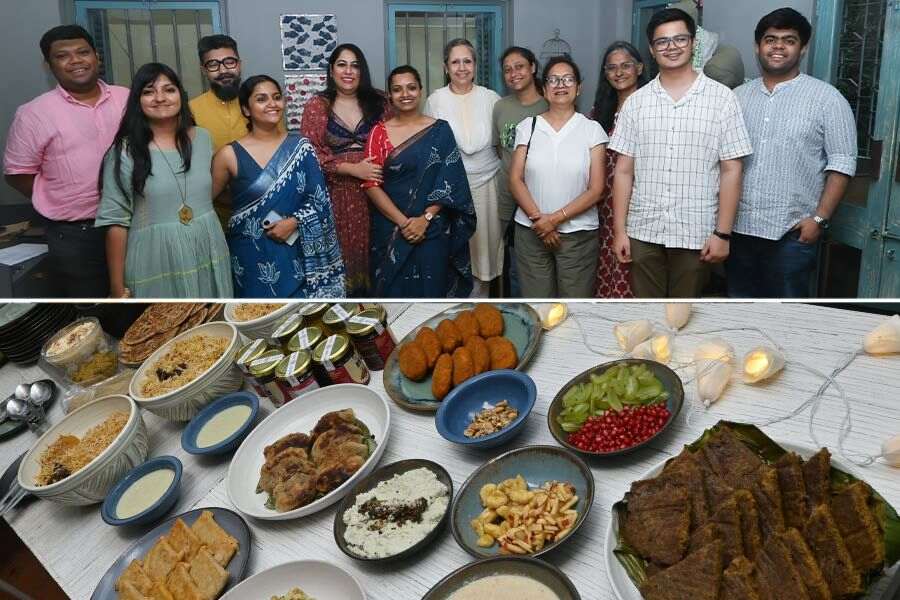
Beat the heat with this Nepali potato-yogurt salad recipe
Grab a copy of ‘Competitive Success: Building Strategies with Corporate War Games’ ASAP
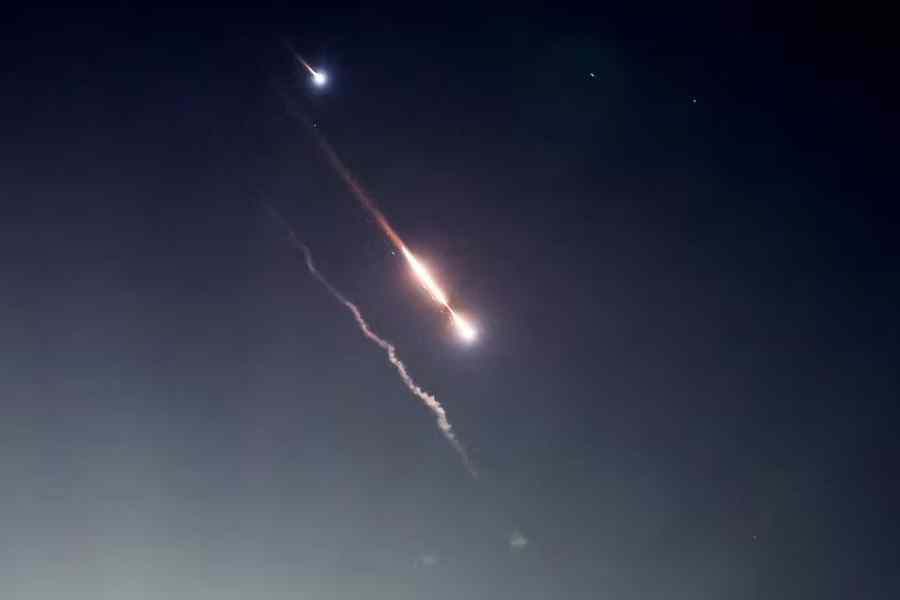
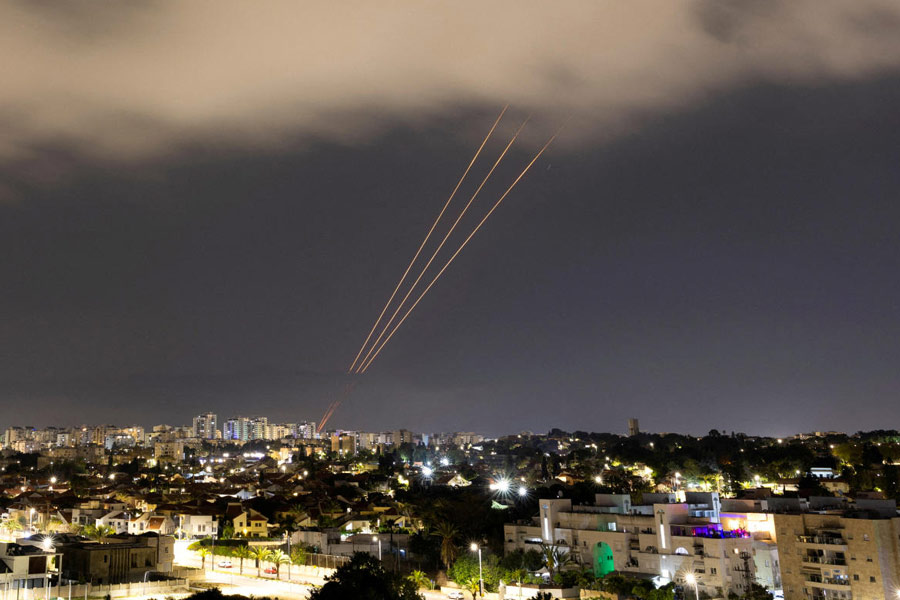
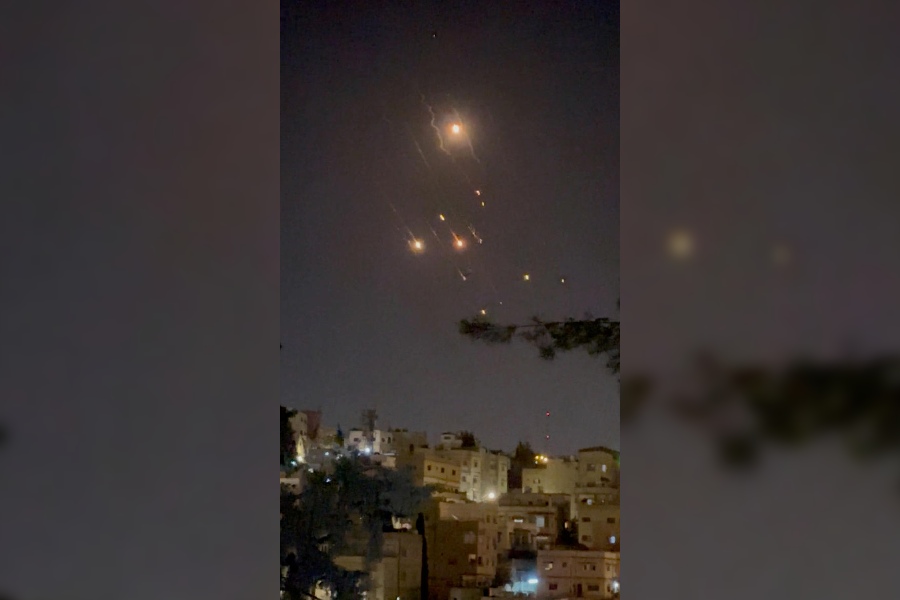
Shortly after the missile strike, President Ebrahim Raisi of Iran issued a statement declaring that the Revolutionary Guard had “taught a lesson to the Zionist enemy”
THOMAS L. FRIEDMAN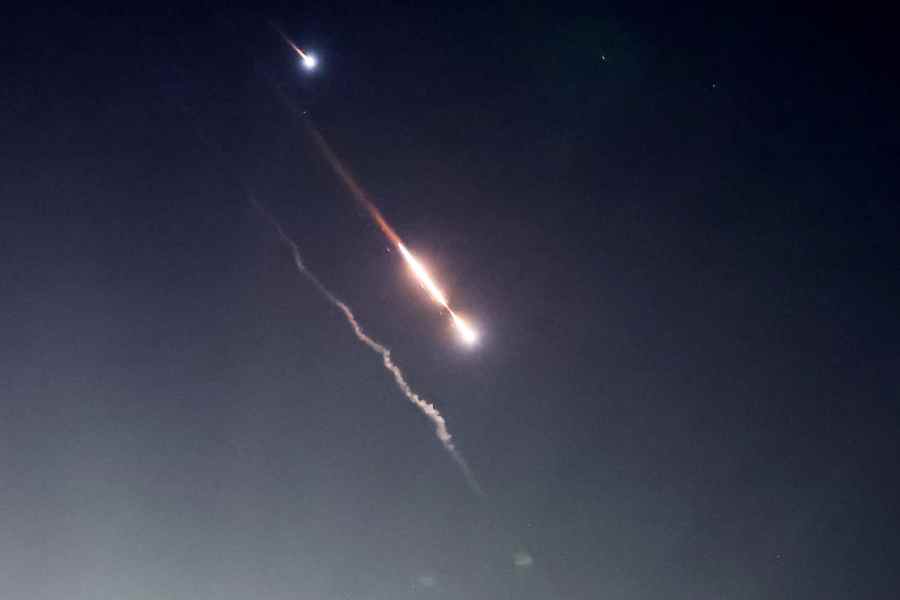
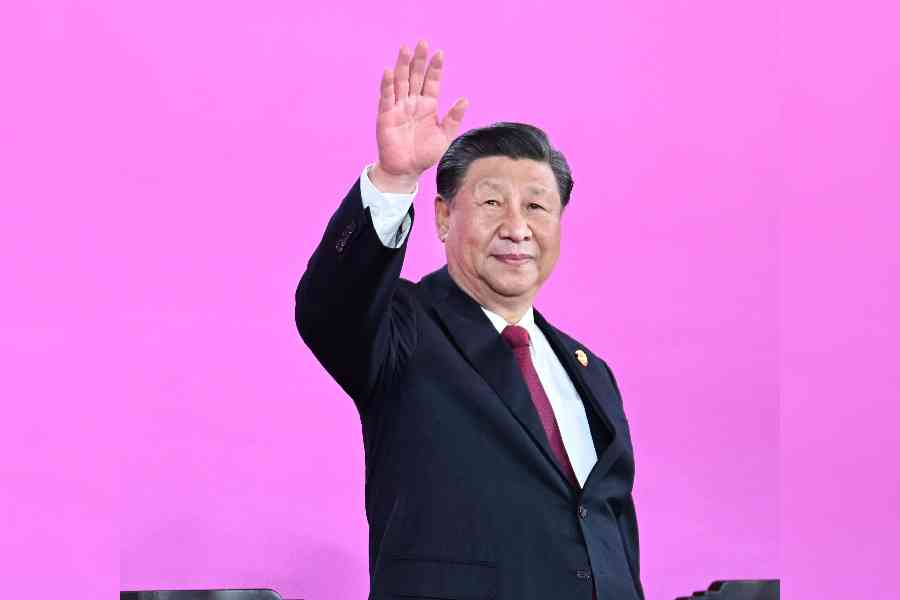
China continues to warn regional players of negative consequences of their actions. Yet, it is Beijing’s own behaviour that is reshaping the Indo-Pacific landscape
HARSH V. PANT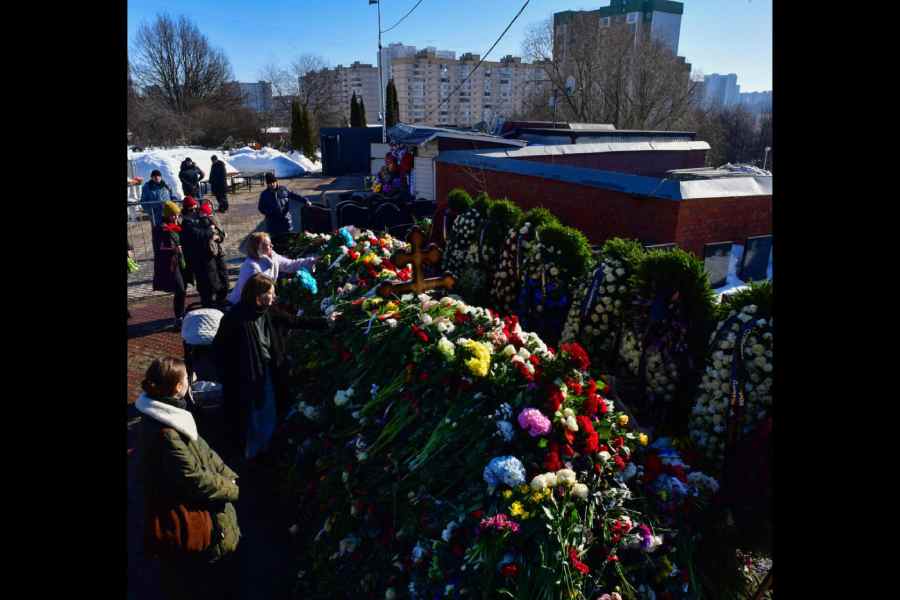
An experienced observer who still lives in Russia tells me he reckons some 20% of the population actively support Putin, 20% actively oppose him, and 60% passively accept things as they are
TIMOTHY GARTON ASH
At a time when biases in our social fabric are being challenged, Generative Artificial Intelligence, in its present state, seems to be dyeing us back to the darker shades of history
SUVRAT ARORA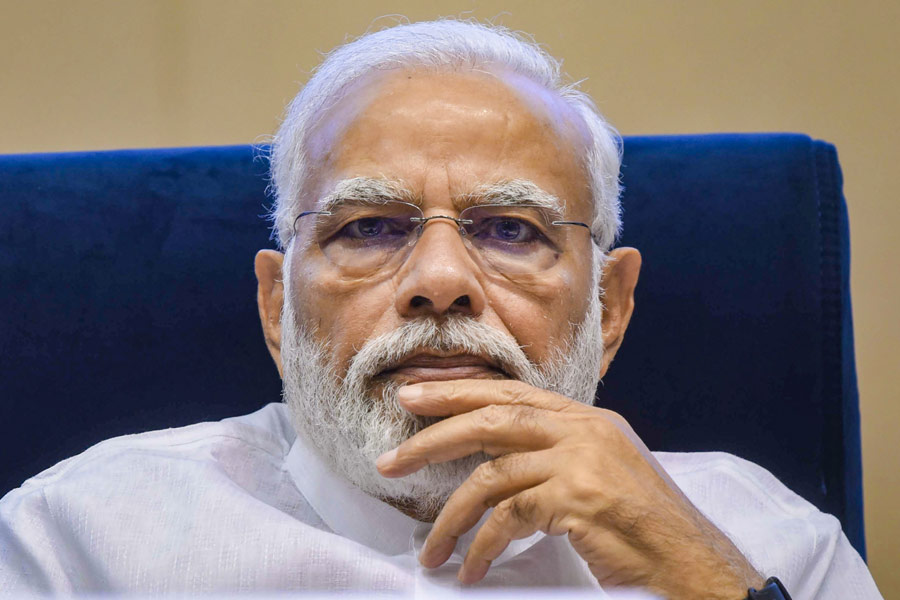
The survey’s identification of collective ambivalence towards what the Opposition believes are the arrows in its quiver could tilt the scales further in the Bharatiya Janata Party’s favour
THE EDITORIAL BOARD


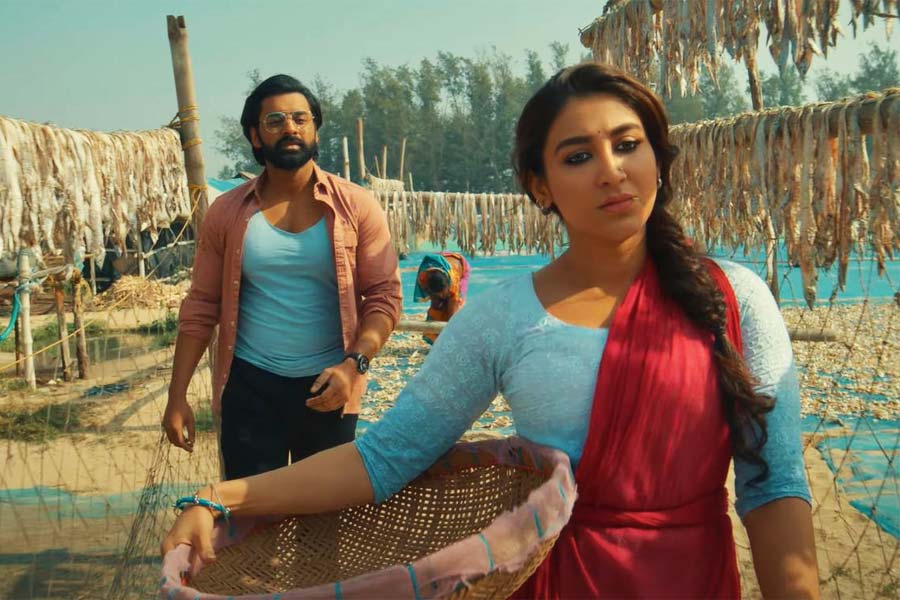
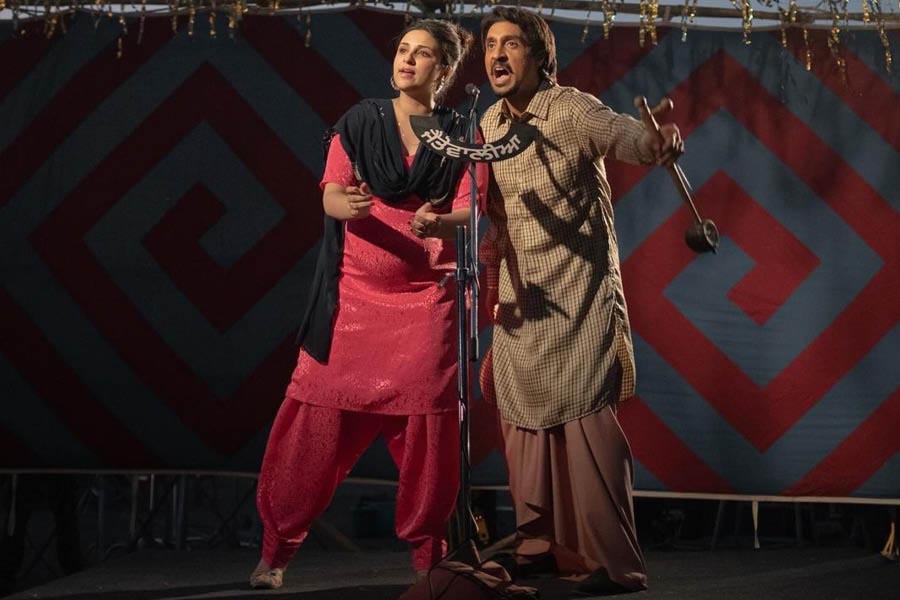
Directed by Sumeet and Saahil, Mirza also stars Kaushik Ganguly, Rishi Kaushik and Shoaib Kabeer