


Dulquer Salmaan’s birthday post for dear daughter is #daddygoals
Ridhima and Gaurav enjoy with baby Dheer in Koh Samui
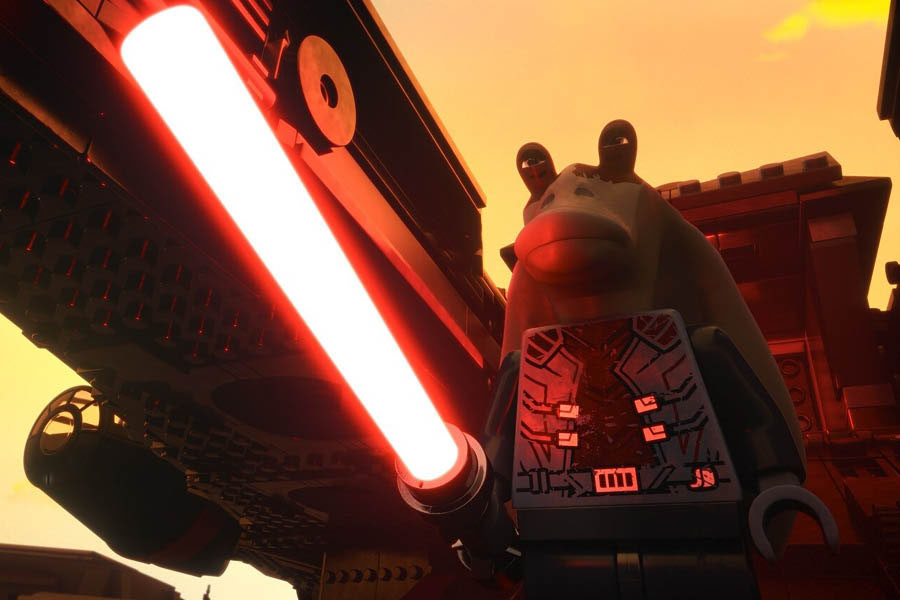
A new show joins the ‘Star Wars’ universe
Check out the Summer Solace menu at The Astor
Coke Studio Bangla’s latest release ‘Ma Lo Ma’ is an ode to life
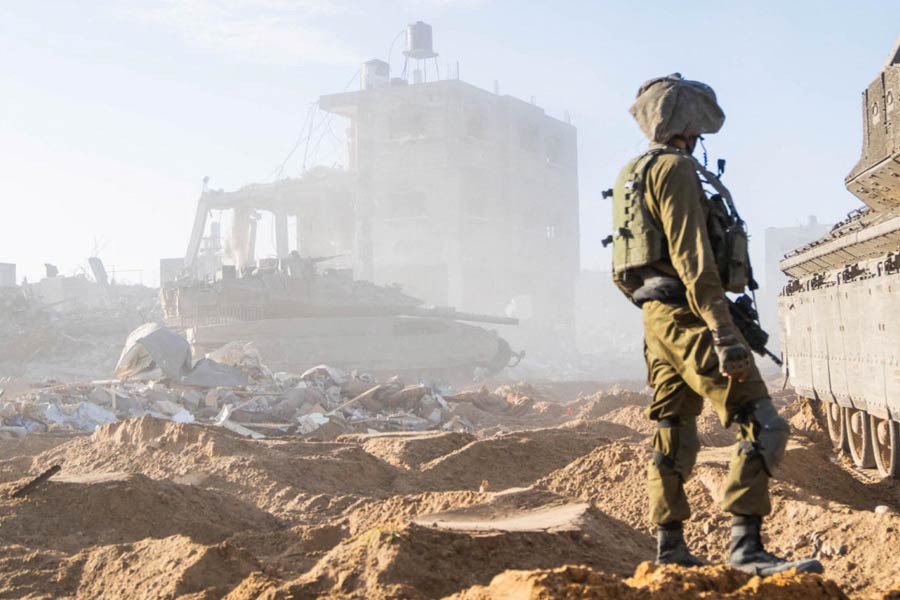
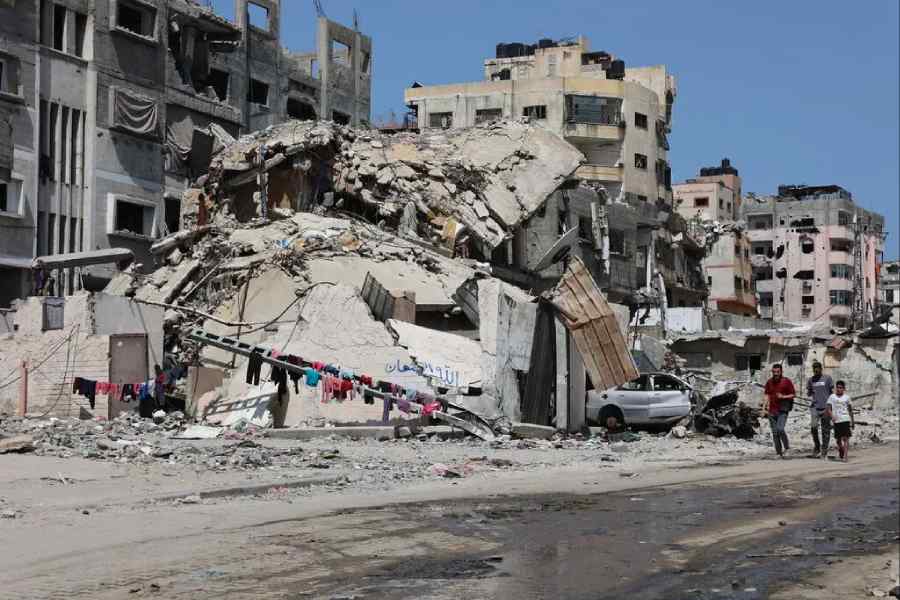
Israel is not the only country where Indian workers face dire working situations. Exploitation of Indian workers under conditions akin to slavery in Singapore & Gulf states has been a long-standing issue
CAROL SCHAEFFER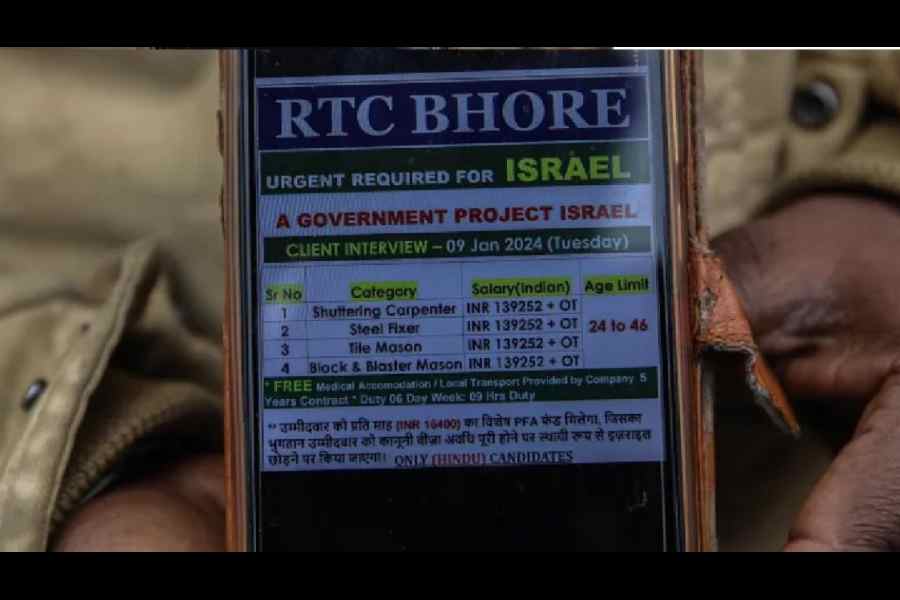
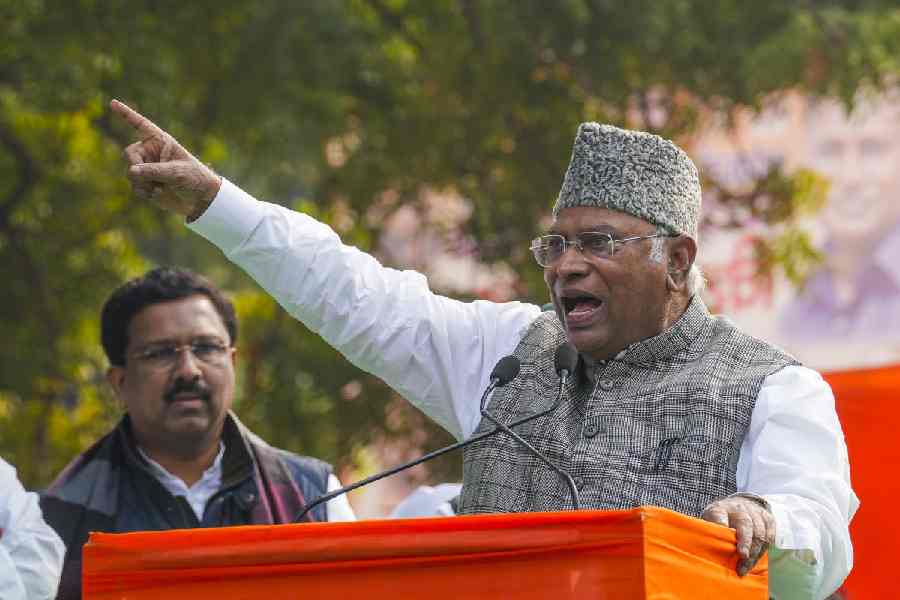
The inclusionary spirit of nation-building was distilled in the Constitution that directs the State to protect equality and non-discrimination that nurture the nation’s diversity
SUHIT K. SEN
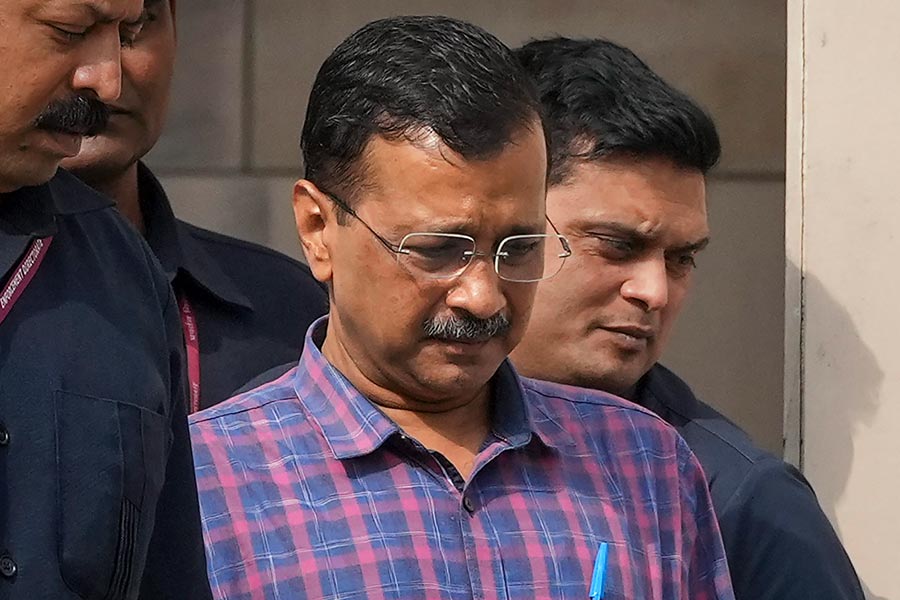
Let us reflect on some hard realities of India. ‘Mere’ corruption is no longer an electoral issue: we do not shun politicians because they might have their hands in the till or in our pockets
SUKANTA CHAUDHURI
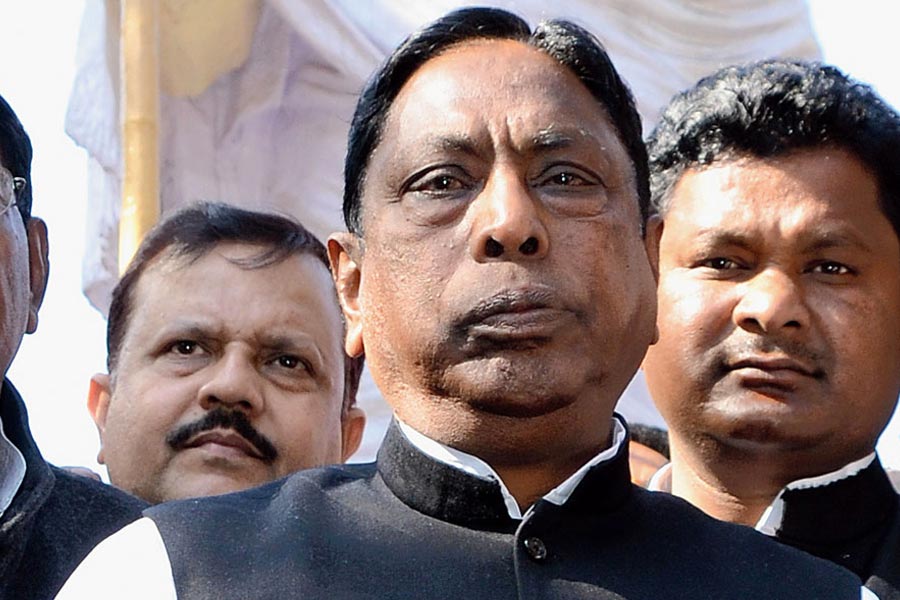
Epidemic Plan, envisioned as a collaborative endeavour among the Central govt, state governments, and relevant stakeholders, aims to provide a comprehensive blueprint for coordinated action
BASIL GUPTA
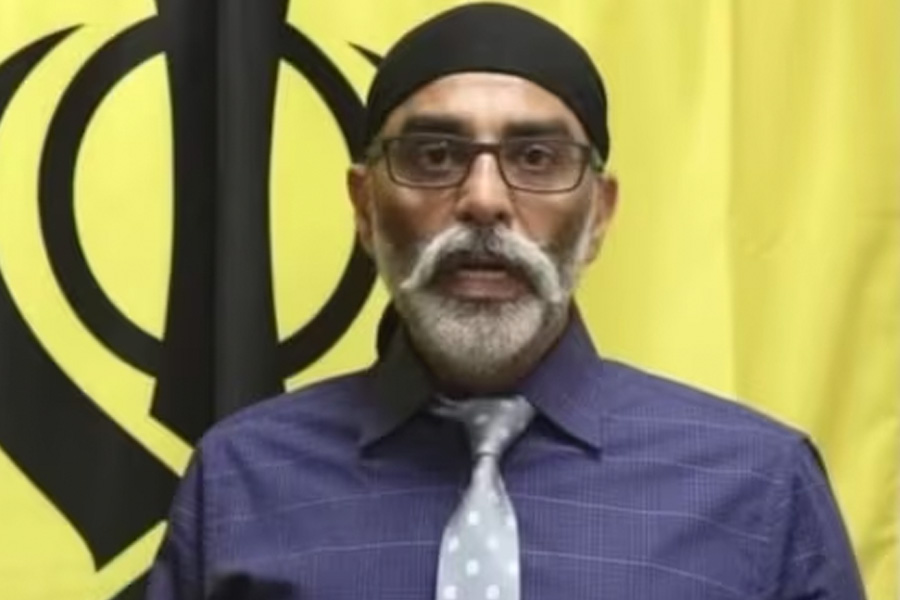
Intelligence-sharing has been at the heart of India’s deepened strategic ties with US & its allies. Such exchange of information relies on mutual trust between intelligence agencies
THE EDITORIAL BOARD


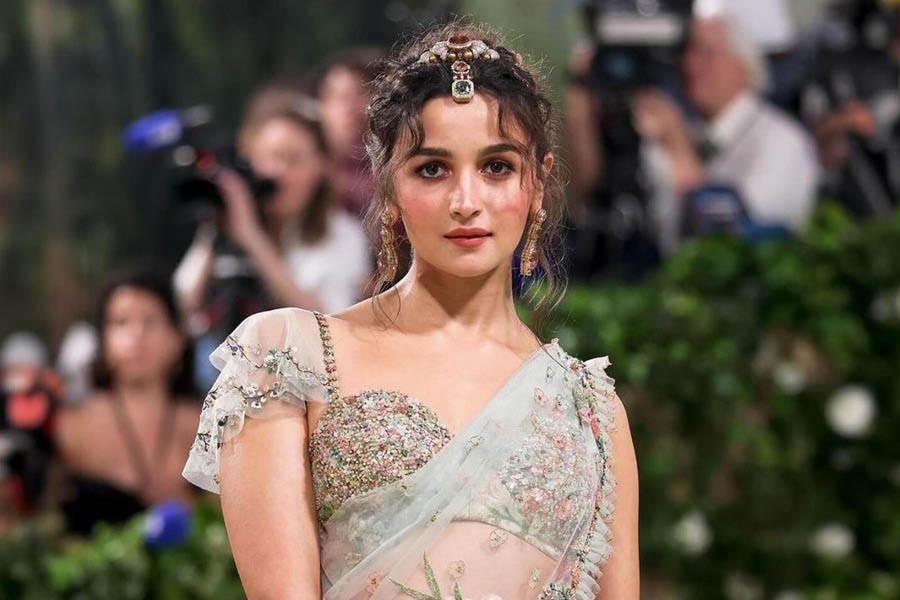
The actress debuted at Met Gala 2023 in a Prabal Gurung gown embellished with over 100,000 pearls