


‘The Boys’ is returning on June 13!
Fans eagerly await the Netflix series after the release of the ‘Senna’ teaser
Here’s a refreshing Mango Coconut Sago recipe to try at home
Have you tasted Swizzle’s ready-to-drink mocktails yet?
This Mother’s Day, curate special gifts from Fabindia
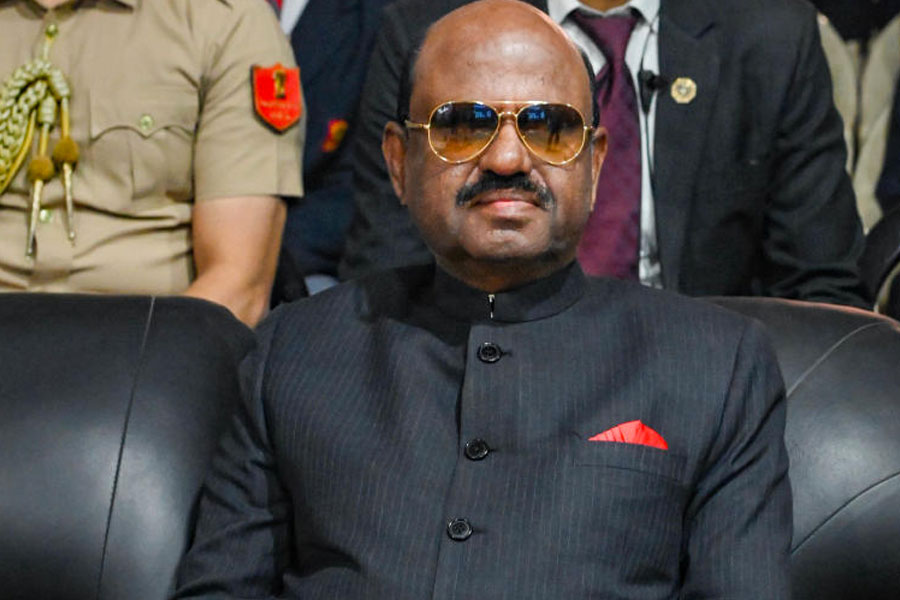
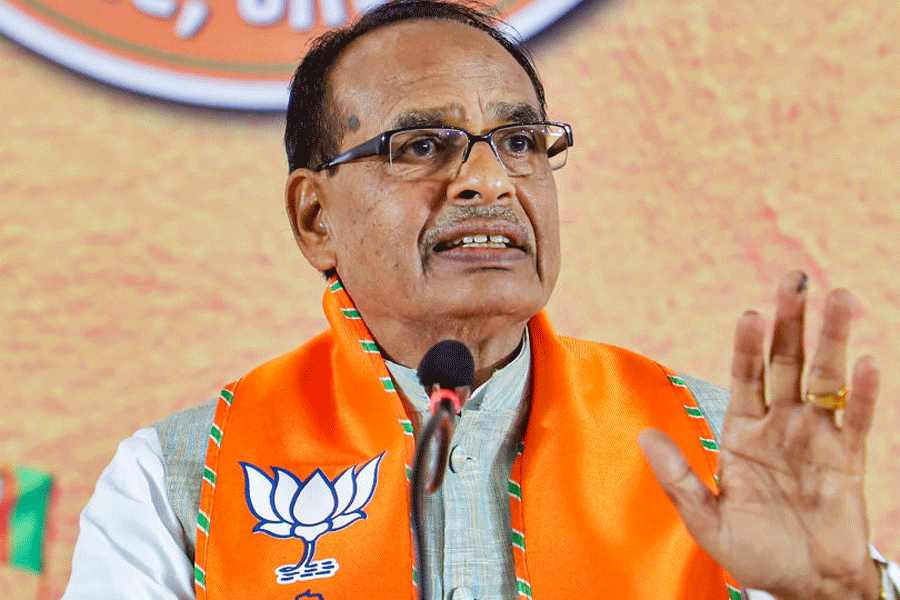
The ideological penetration of Indian science by Hindutva was starkly illustrated by a series of nine linked tweets issued by the secretary of the department of science and technology last month
RAMACHANDRA GUHA
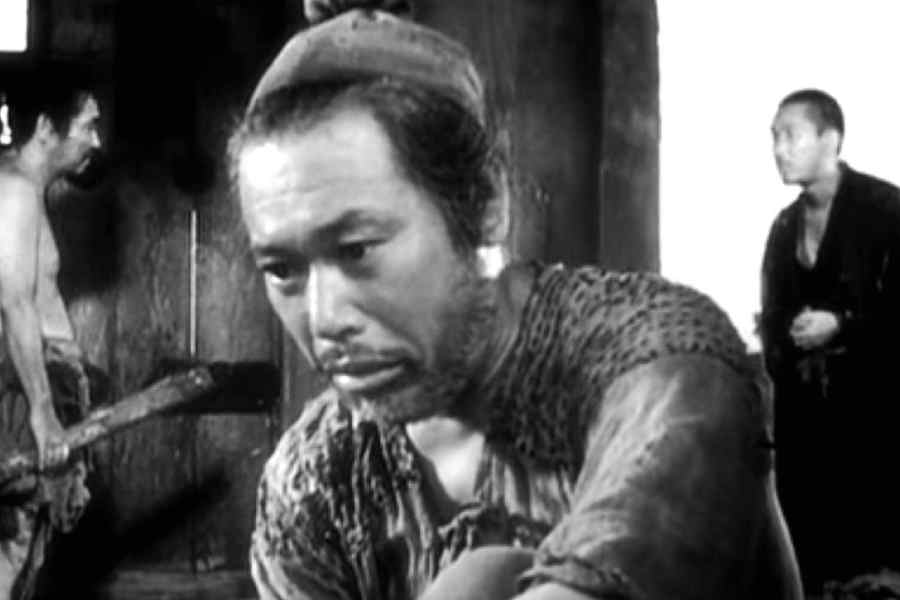
For the last three hundred years, the world is being ruled by the West. Naturally, in all wars during this period, the narratives floated by the West have dominated those framed by its enemies
KAUSHIK BHATTACHARYA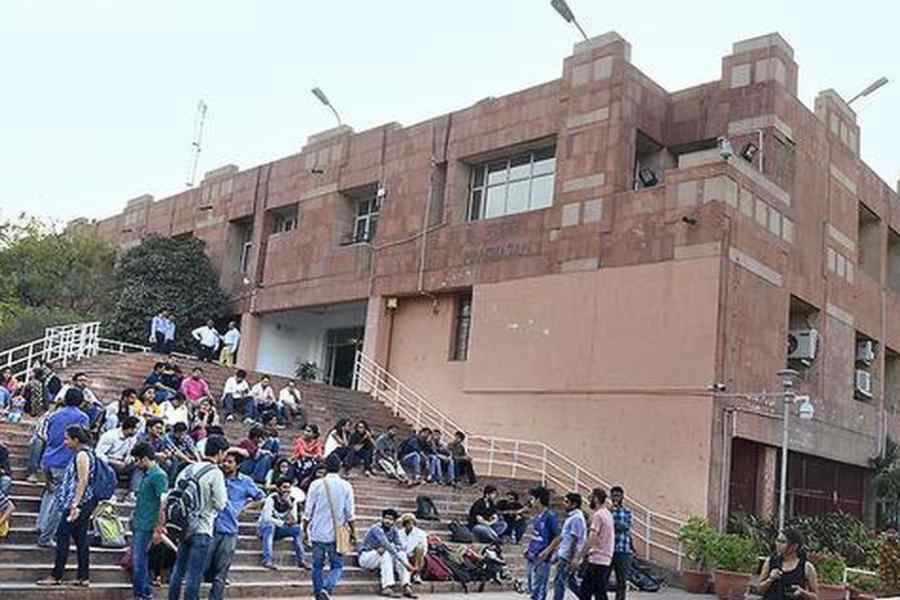
For JNU to regain its position, the unique features that made it a great institution need to be brought back in the form of inclusive admission, academic practices, and participatory governance
SUKHADEO THORAT
CHINA DIARY | A furious counsellor probably decided to teach the fresher a lesson she’d never forget, or at least that’s how Chun’s mother sees it. The college, expectedly, refutes this
NEHA SAHAY
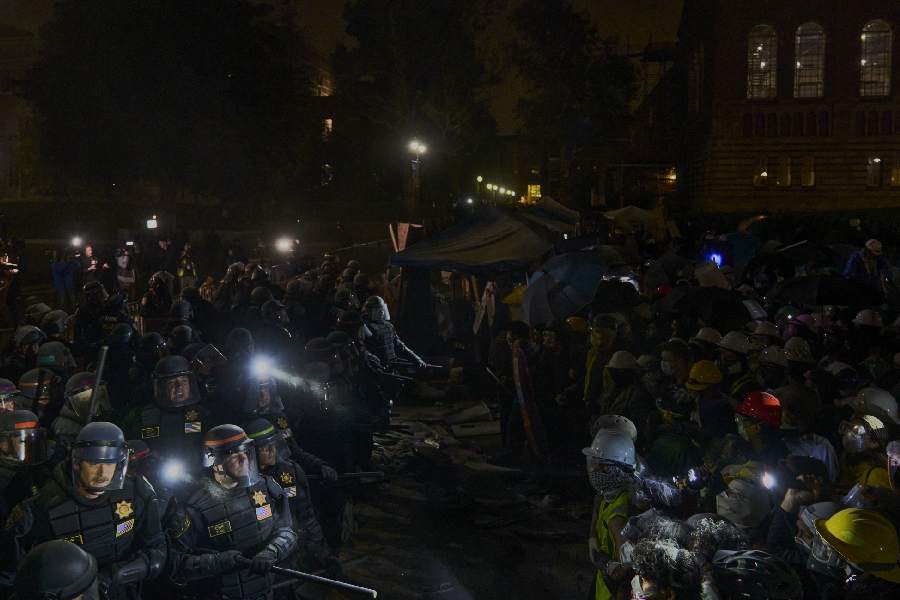
Most universities and even the US president, Joe Biden, have portrayed the student protesters as a dangerous problem and have been unwilling to meaningfully engage with their demands
THE EDITORIAL BOARD


Ranneeti: Balakot & Beyond and Panchayat Season 3 have also made it to the list based on buzz among audience