


Ranveer Brar pays tribute to Ray on the filmmaker’s birth anniversary
Benedict Cumberbatch gives a cerebral performance in ‘Eric’ trailer
Ritabhari Chakraborty shares photos from her London trip on Instagram
This Alphonso mango gateaux recipe by Rahul Arora will make you drool
Keep harmful UV rays at bay with Suroskie's sunscreen
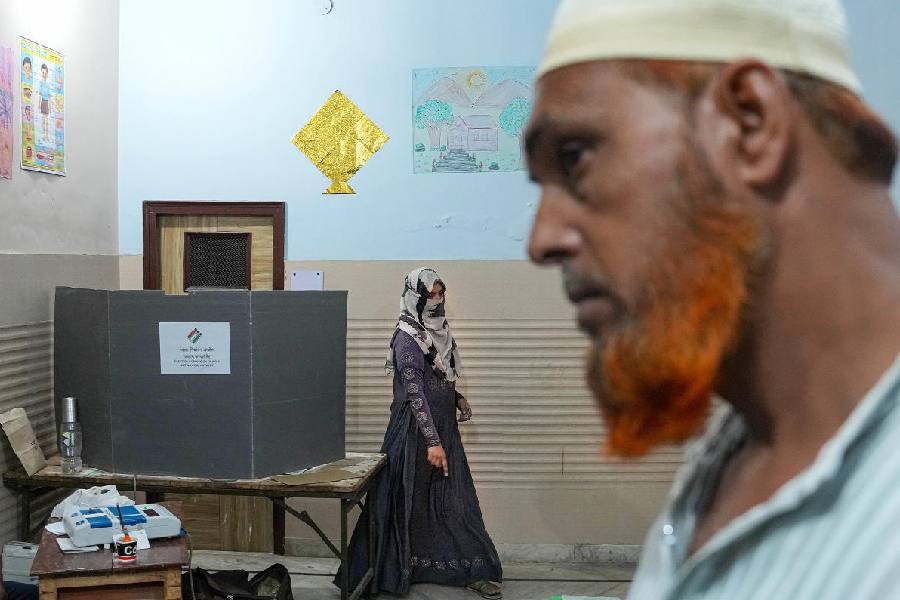
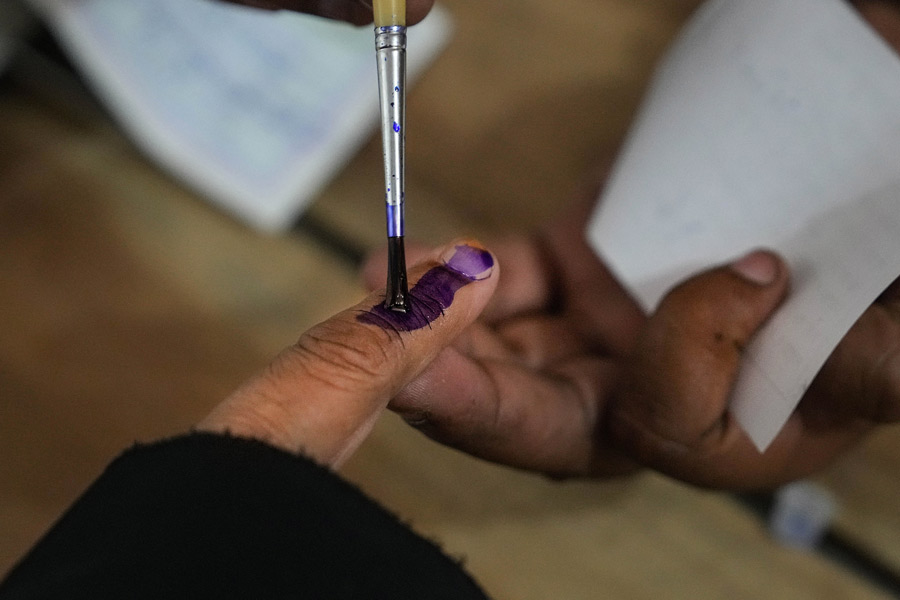
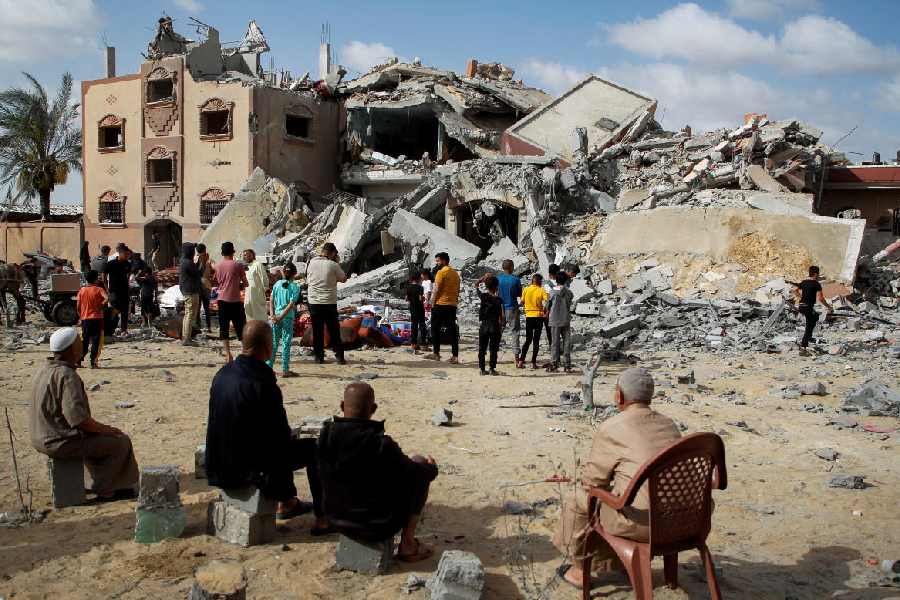
The attitude of the West to its Muslim citizens is beginning to mirror their hostility towards non-client Muslim states abroad. Some of this is a hangover of the ‘war on terror’ since 9/11
MUKUL KESAVAN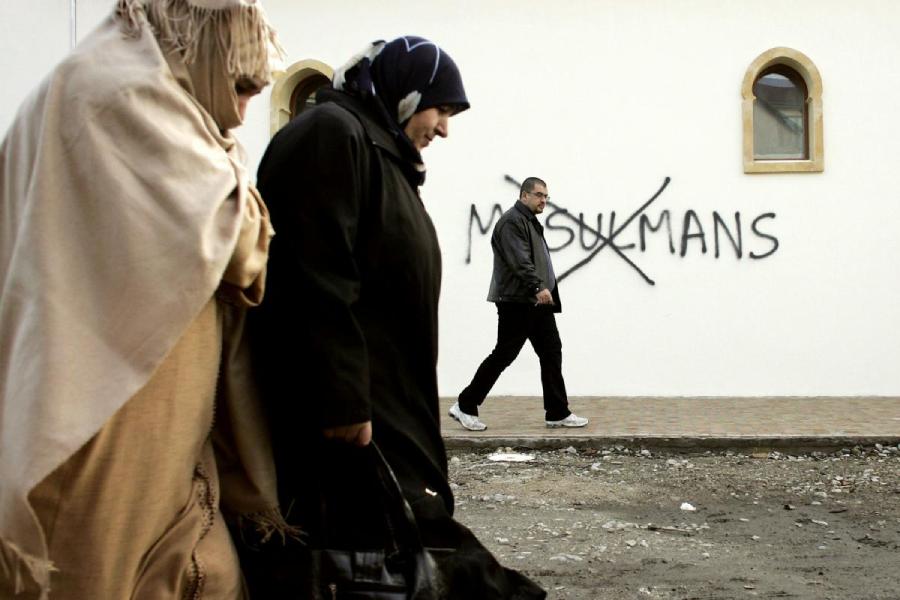

The ideological penetration of Indian science by Hindutva was starkly illustrated by a series of nine linked tweets issued by the secretary of the department of science and technology last month
RAMACHANDRA GUHA
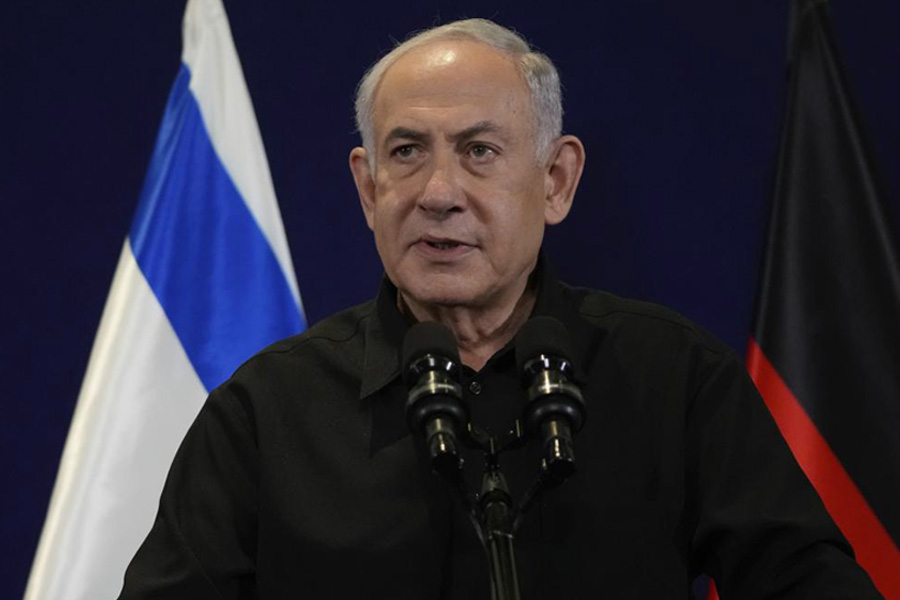
For the last three hundred years, the world is being ruled by the West. Naturally, in all wars during this period, the narratives floated by the West have dominated those framed by its enemies
KAUSHIK BHATTACHARYA
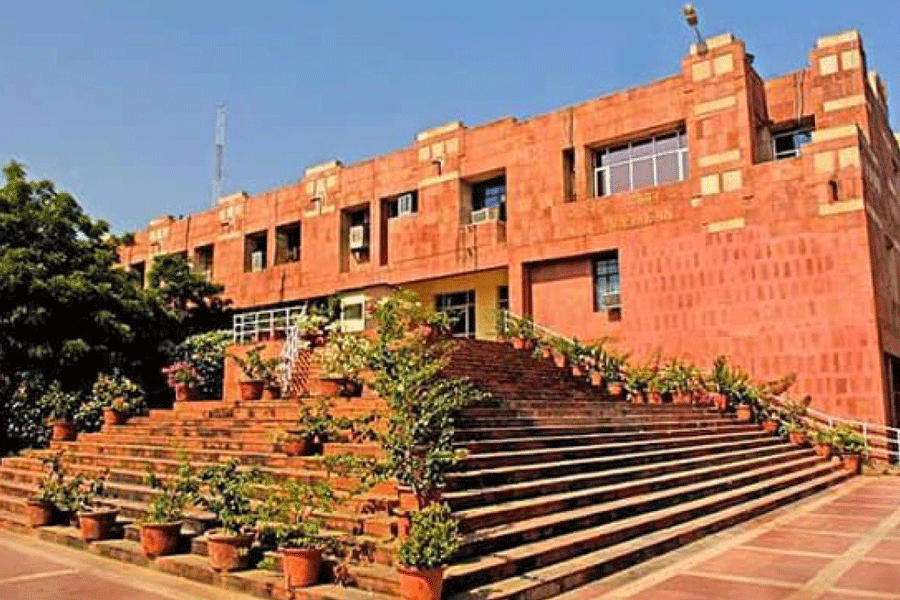
For JNU to regain its position, the unique features that made it a great institution need to be brought back in the form of inclusive admission, academic practices, and participatory governance
SUKHADEO THORAT
According to a global gender health gap analysis published in The Lancet Public Health, men experience a greater degree of deteriorating health and have a higher burden of diseases
THE EDITORIAL BOARD


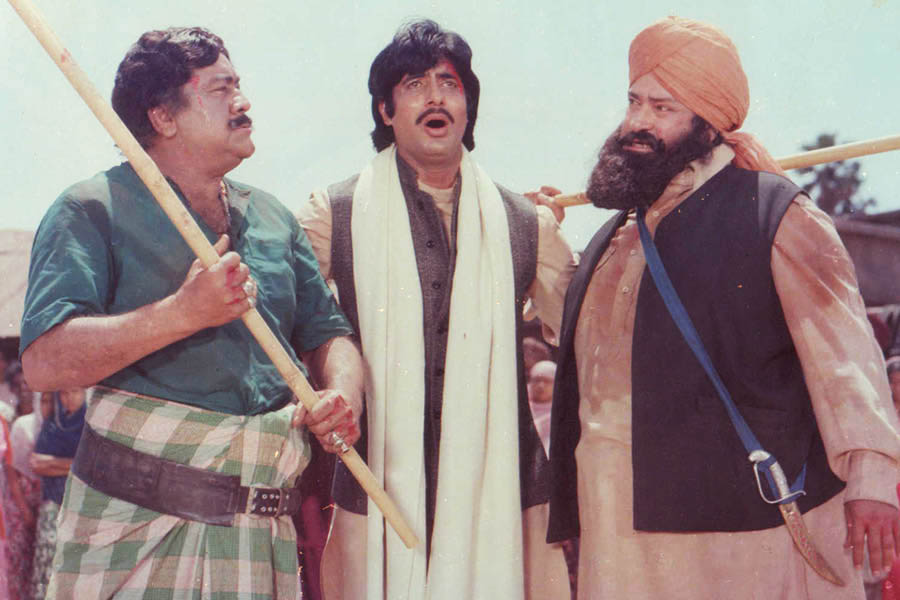
The film co-starring Hema Malini, Sharmila Tagore and Parveen Babi was released on April 23, 1982