


![Narendra Modi and Mallikarjun Kharge [Inset]](https://assets.telegraphindia.com/telegraph/2024/Mar/1711893412_1704002323_1700975369_1694764982_modi-kharge.jpg)


Nussrat’s li’l munchkin Yishaan makes social media debut on Mother’s Day
Taimur and Jehangir help Kareena polish off her Mother’s Day cake
It’s ‘family funday’ for Priyanka, Nick and li’l Malti Marie
Akshata Murty plays ball with school kids at 10 Downing Street
Stand-up comedian Shane Gillis is the face of new Netflix comedy, ‘Tires’
Learning from the past involves seeing the interaction between deep structures and processes, on the one hand, and among contingency, conjuncture, collective will and individual leadership on the other
TIMOTHY GARTON ASH

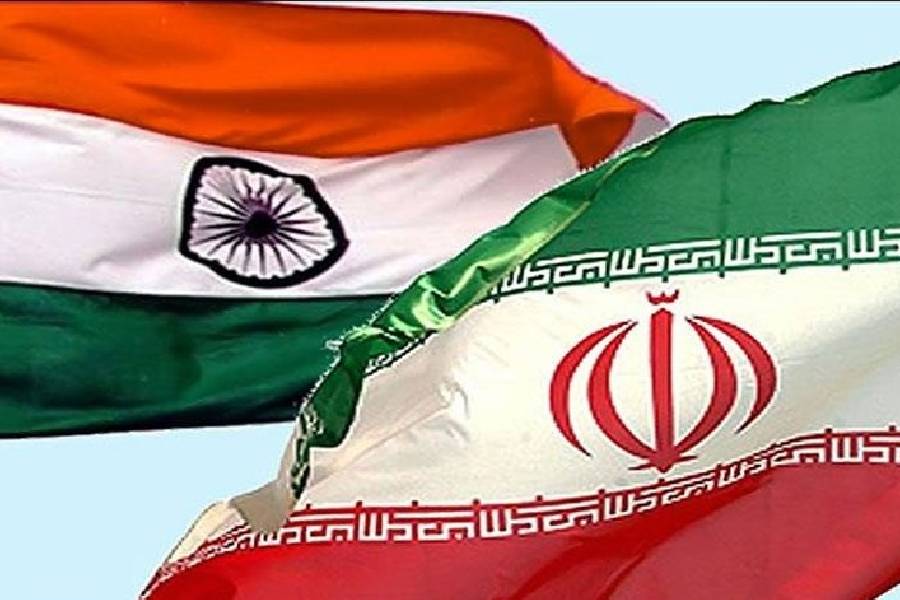
An FTA with the United Kingdom is in the works; once implemented, the UK-India FTA will be the first such free trade agreement that India would have with a major Western power
PRANAY SHOME
The bigotry that the Congress used as a touch paper in 1984 had to be, therefore, a form of Hindu communalism, born in part out of a resentment of Sikh secessionism and militancy
MUKUL KESAVAN
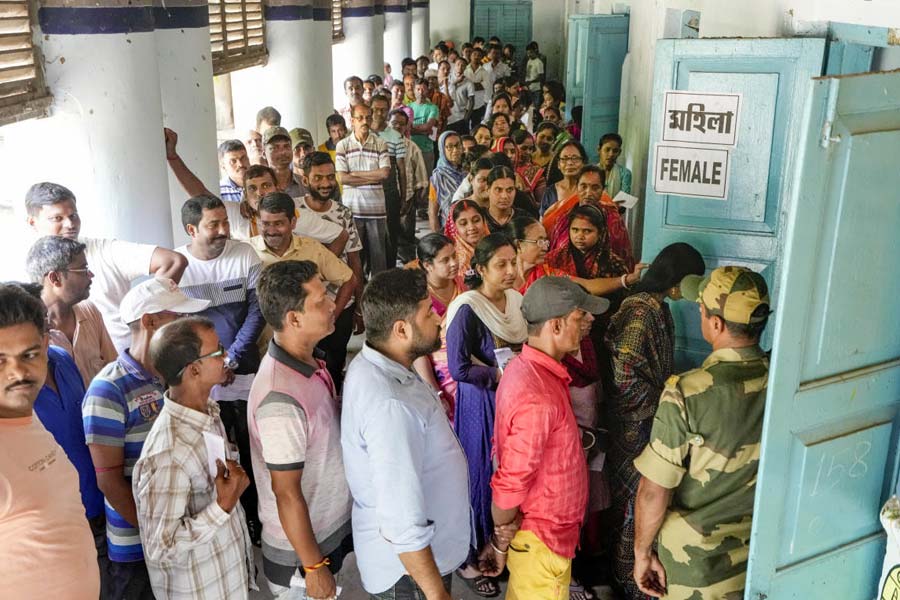
Things are often aggravated in the hills. The seven-phase Lok Sabha election heightens the drama with ominous warnings that Sikkim might one day acquire a Bihari or Marwari chief minister
SUNANDA K. DATTA-RAY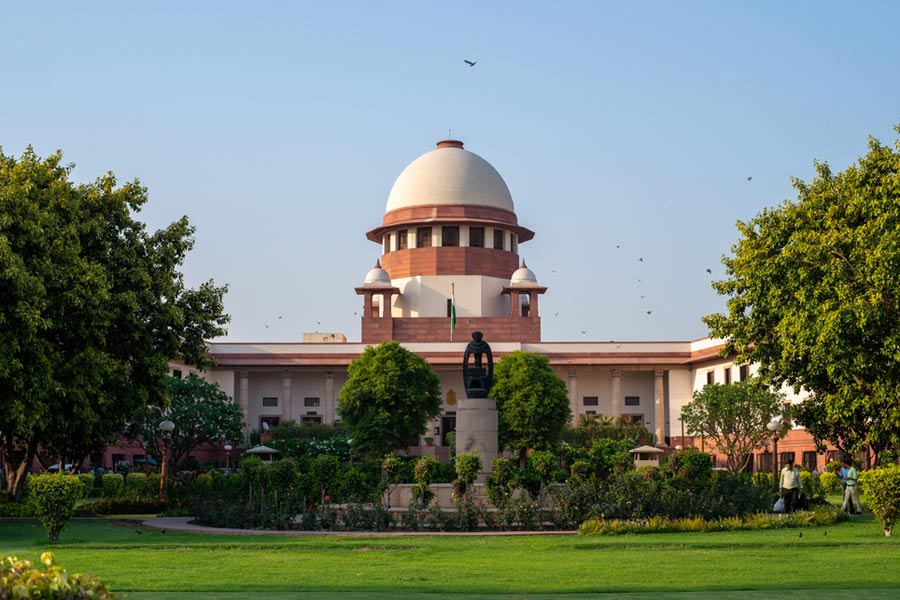
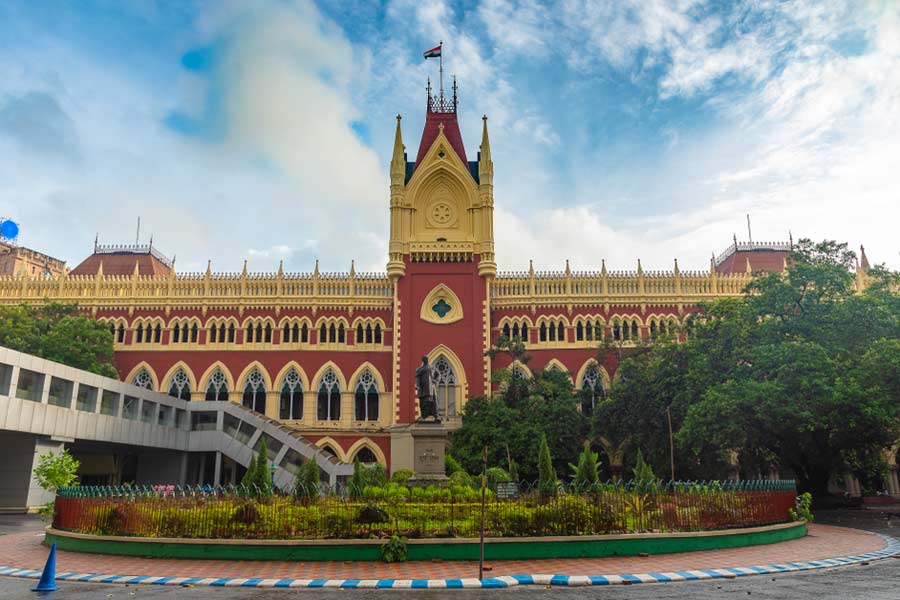
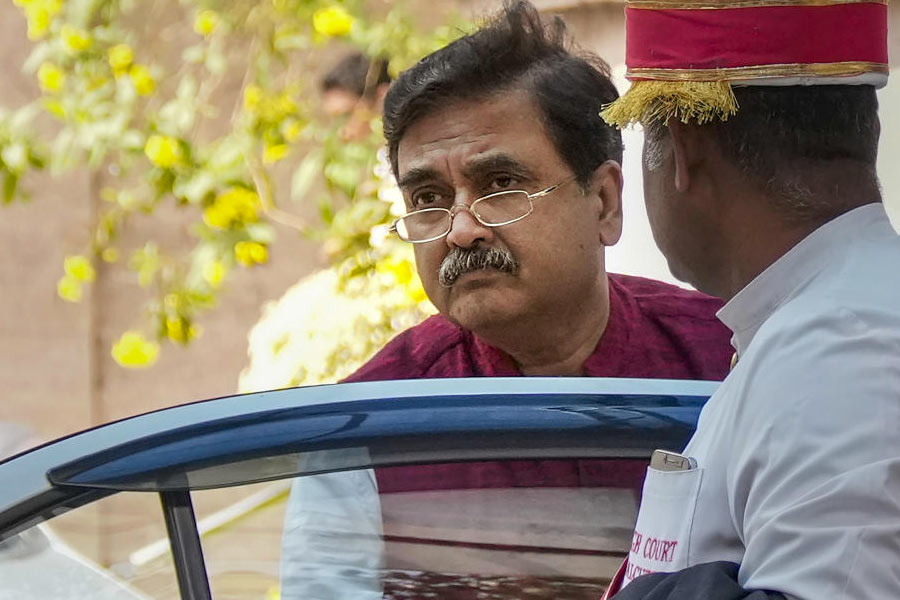
The bench even admonished counsel for bringing up the name of the former judge of Calcutta HC, Abhijit Gangopadhyay, who is now the Bharatiya Janata Party's LS candidate from Tamluk
THE EDITORIAL BOARD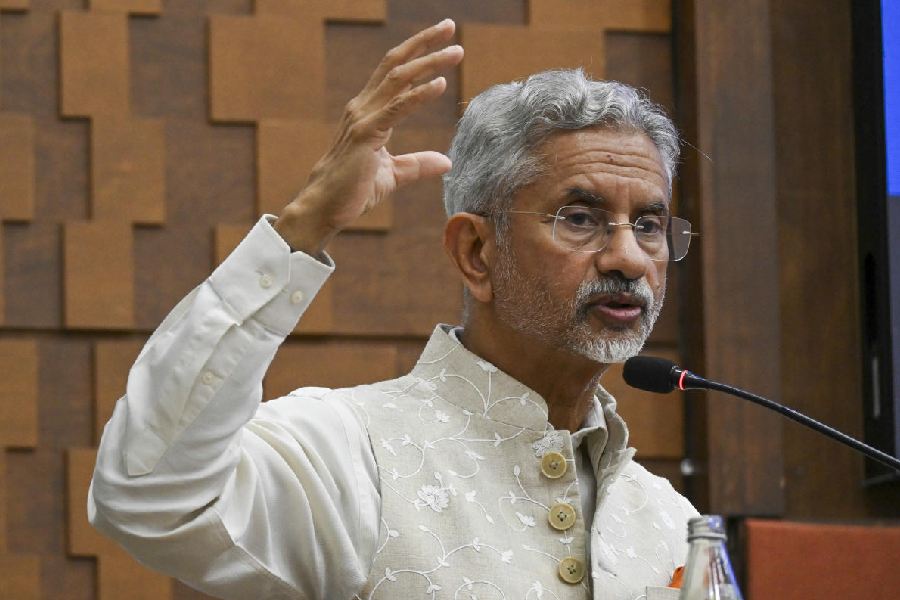


21-year-old Arhaan Khan studied filmmaking in the US; his podcast Dumb Biryani is streaming on YouTube