


‘Master Blaster’ Sachin Tendulkar united IPL’s biggest rivals today
Mimi embodies the spirit of Earth Day by picking plastic on the beach
Marvel releases trailer for ‘Deadpool & Wolverine’
Salman Rushdie’s ‘Knife: Meditations After an Attempted Murder’ is out now
This Sugar-Free Fig and Walnut Kulfi is the ultimate summer treat
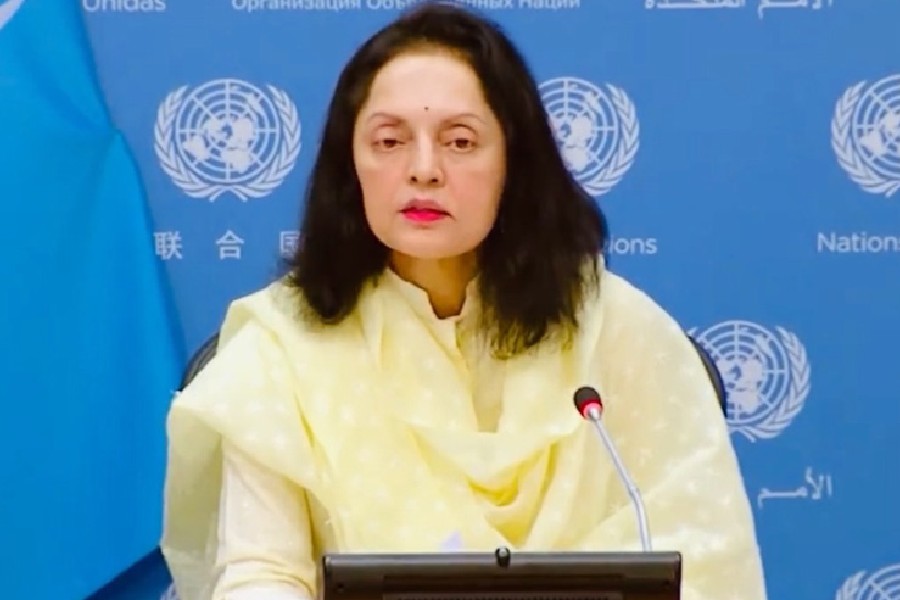
Privilege may make one indifferent to assertions of identity and communal relationship, but marginality and fear of oppression are far likelier to make one withhold or even hide such assertions
SAIKAT MAJUMDAR

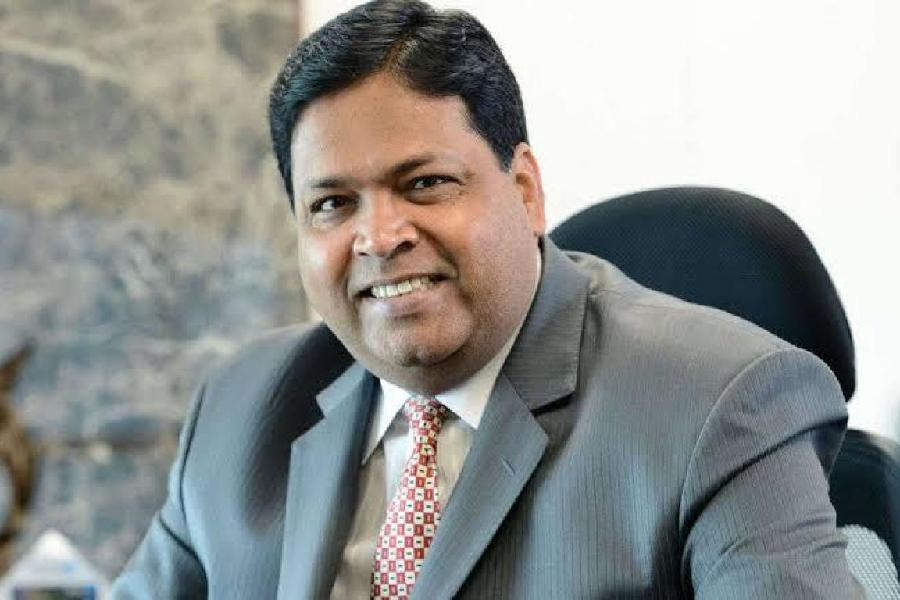
Now the geostrategic risks Muizzu took appear to have paid off. China knows that in Muizzu it has a partner who is in complete command in the Maldives, and who it can invest in
CHARU SUDAN KASTURI
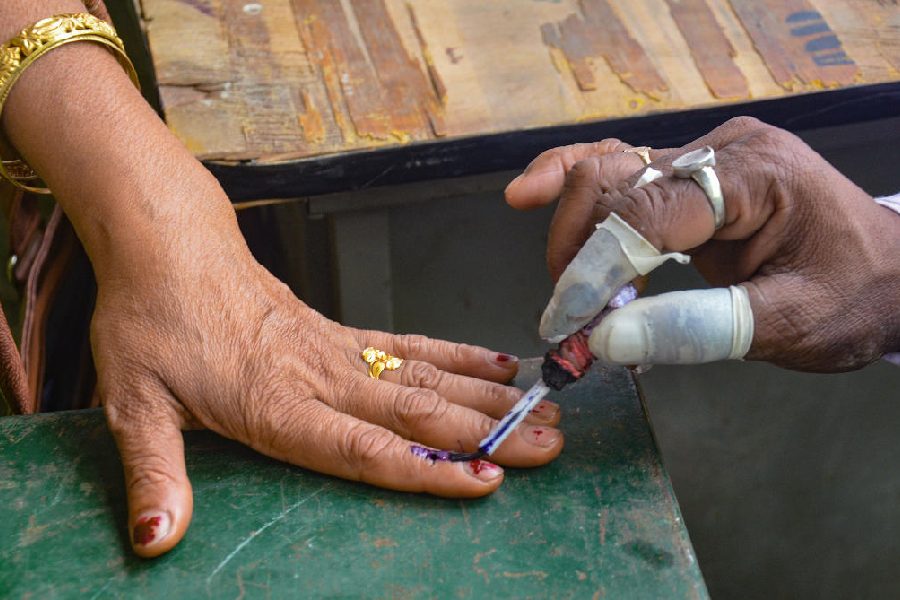
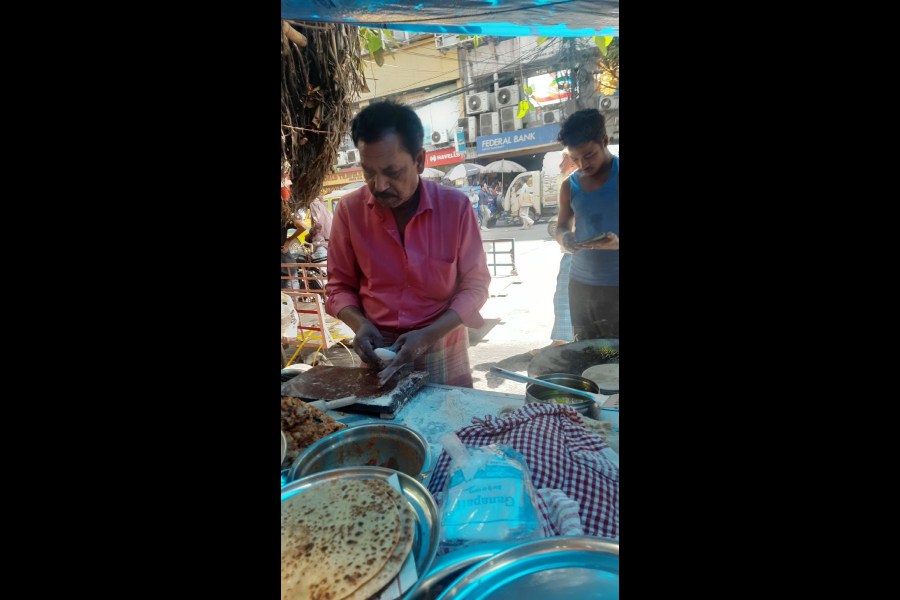
Some argue that the cops wearing Hindu attire is nothing more than a gimmick initiated by senior police officers who want to please their current political masters during the election season
SUSHANT SINGH
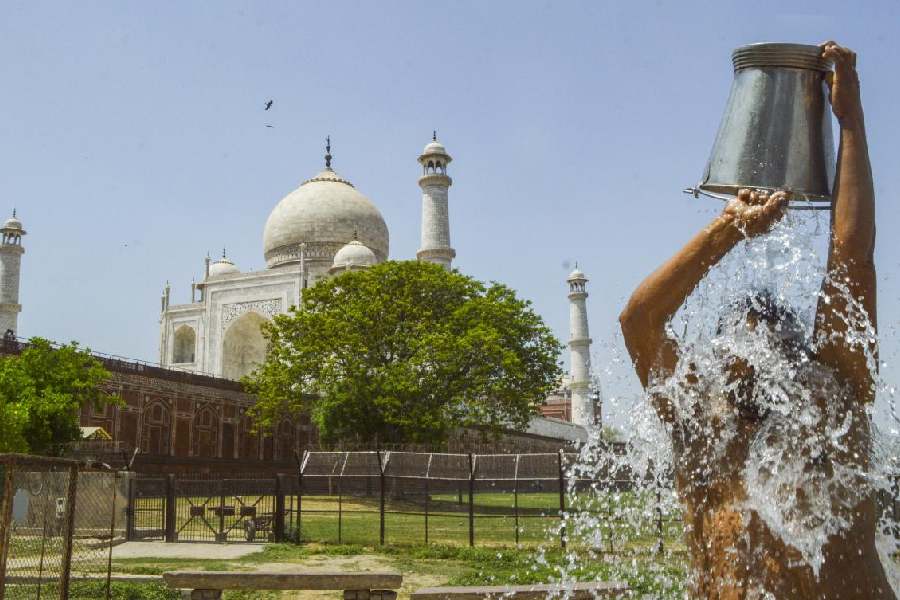
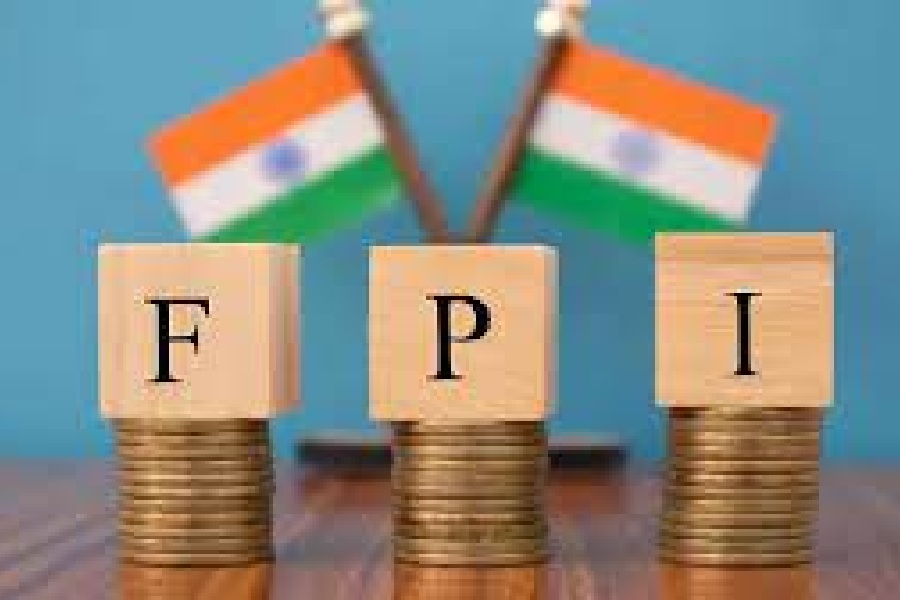
The demand for energy and other resources will be far greater than what it is now, not only because of the higher numbers but also because of greater consumption by those moving out of poverty
ANAMITRA ANURAG DANDA
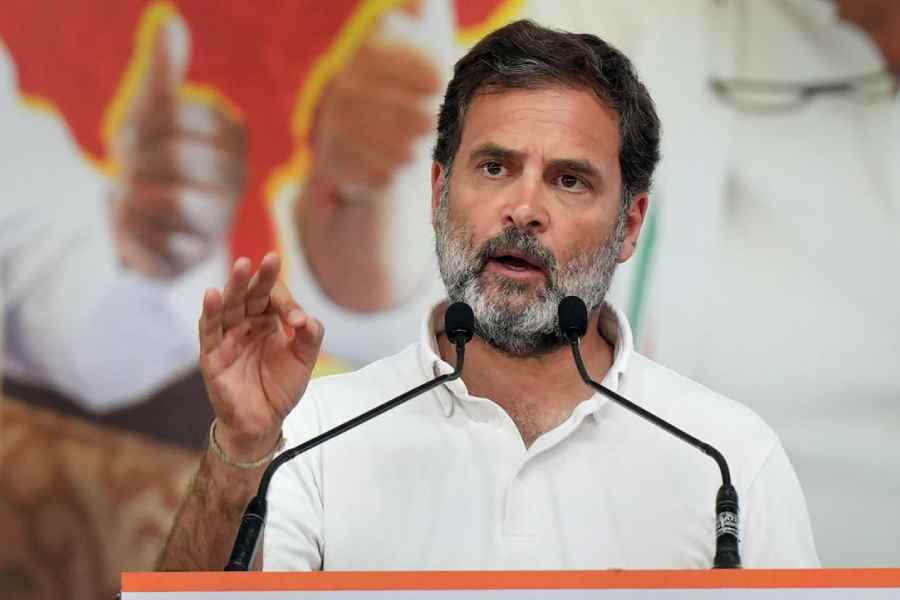
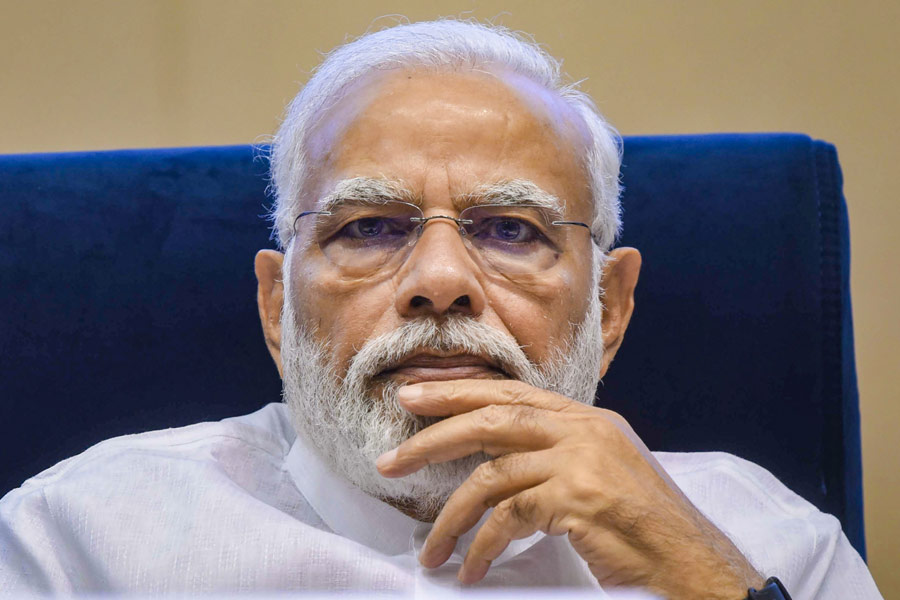
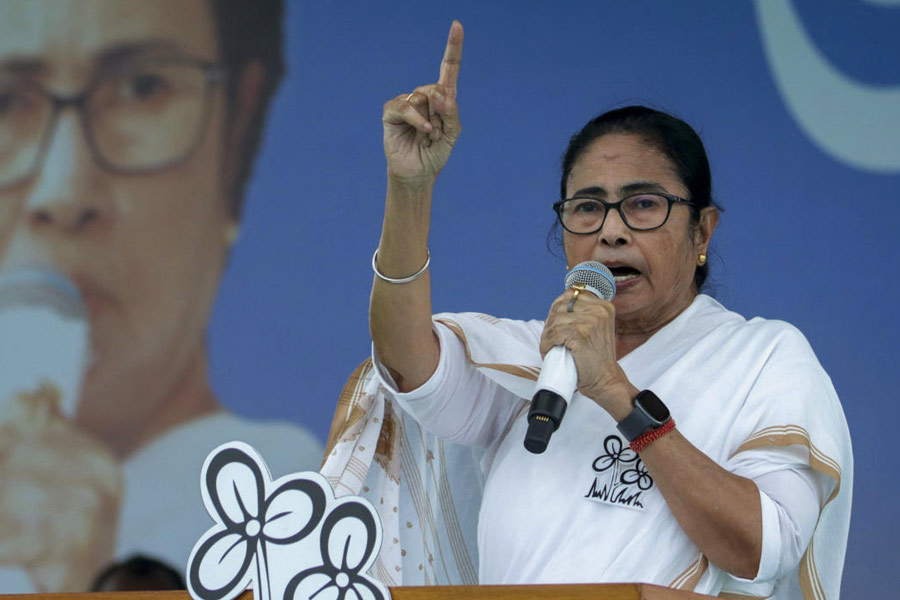
There is reason to believe that BJP is now falling back on its tried-and-tested polarising policy that always yields dividends. This merits speculation about the likely causes of this shift
THE EDITORIAL BOARD


Maheep, Bhavana, Neelam Kothari Soni and Seema Kiran Sajdeh are part of popular Netflix reality series Fabulous Lives of Bollywood Wives, which has been renewed for a third season