


Satyajit Ray’s birthday ignites a sense of community among admirers
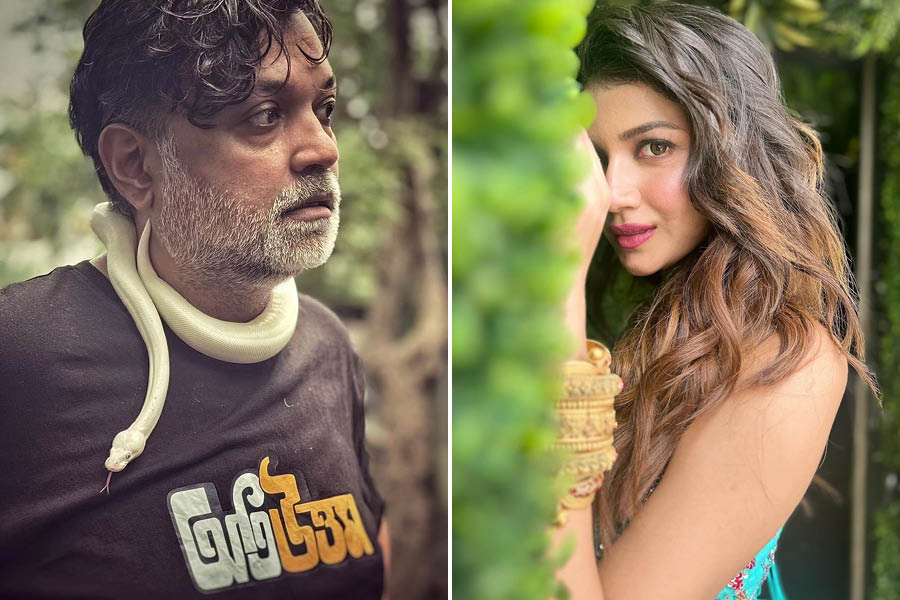
Sohini’s recent IG post will make you sing ‘Starry, Starry Night’
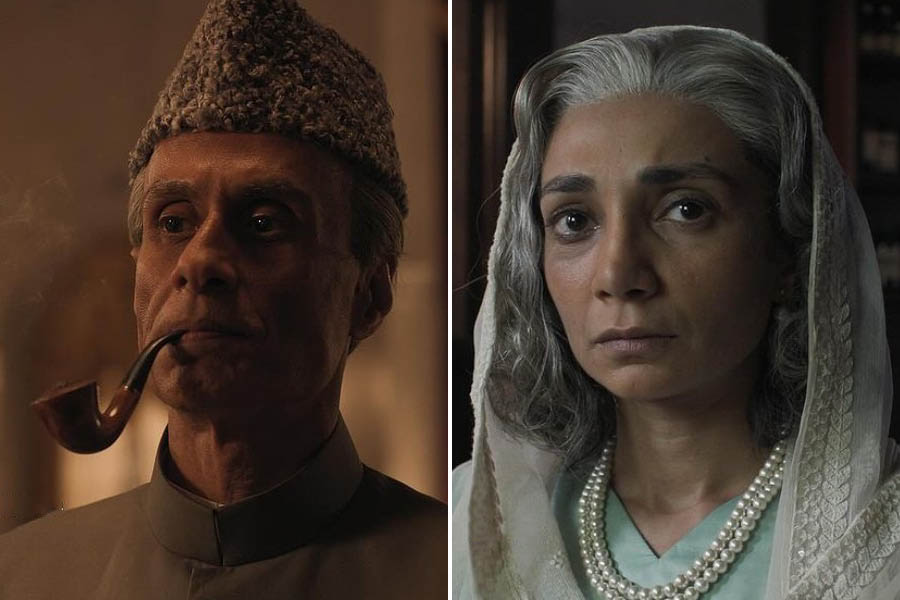
‘The Commandant’s Shadow’ is sure to send chills down your spine
Make yourself a fancy summer tipple at home with this iced tea recipe
The Big Family blues band to take centre stage at Skinny Mo’s Jazz Club
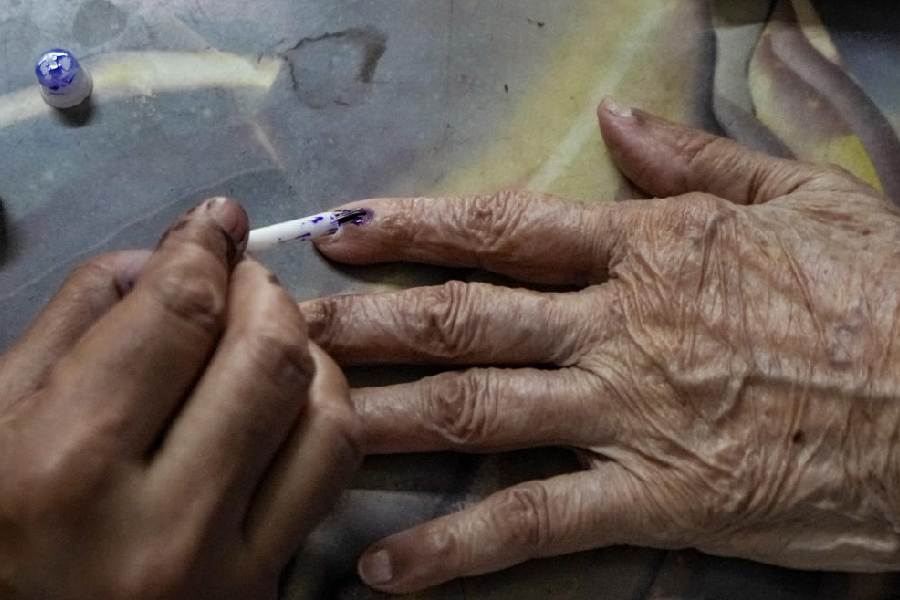
The cumbersome, seven-phase 18th Lok Sabha election heightens the drama with ominous warnings that Sikkim might one day acquire a Bihari or Marwari chief minister
SUNANDA K. DATTA-RAY
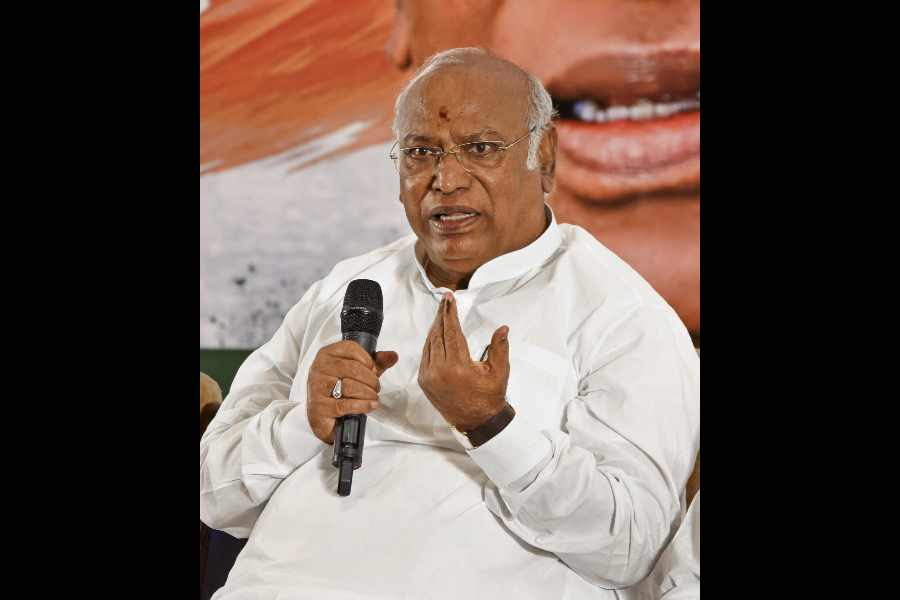
When the Babri Masjid was demolished, the response in Kerala was driven by secular values. But now I find that some people are openly supporting such indefensible acts
R. RAJAGOPAL
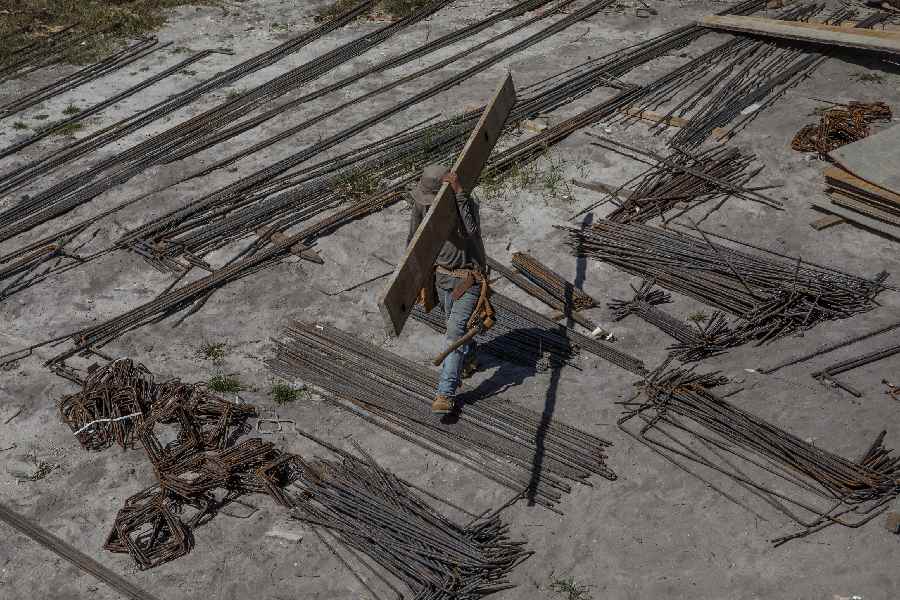
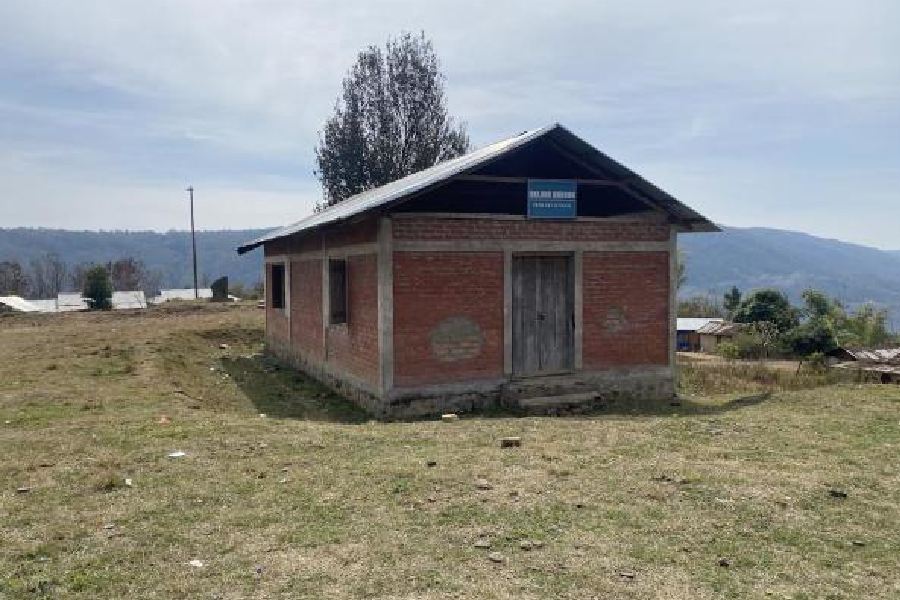
FRA seems to be a crucial issue in many constituencies — most acutely in states like Jharkhand, Madhya Pradesh and Odisha — that are going to the polls in the remaining phases of the elections
JAIDEEP HARDIKAR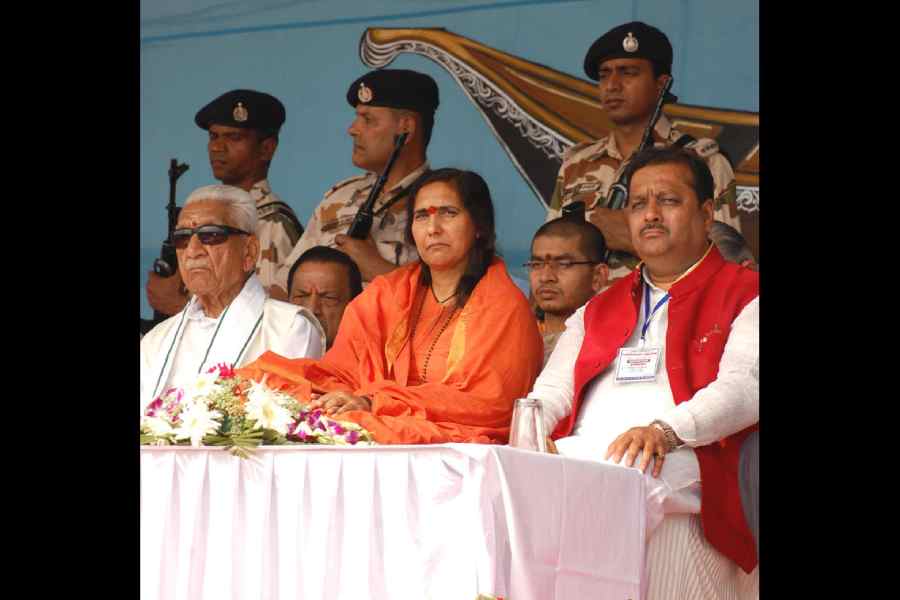
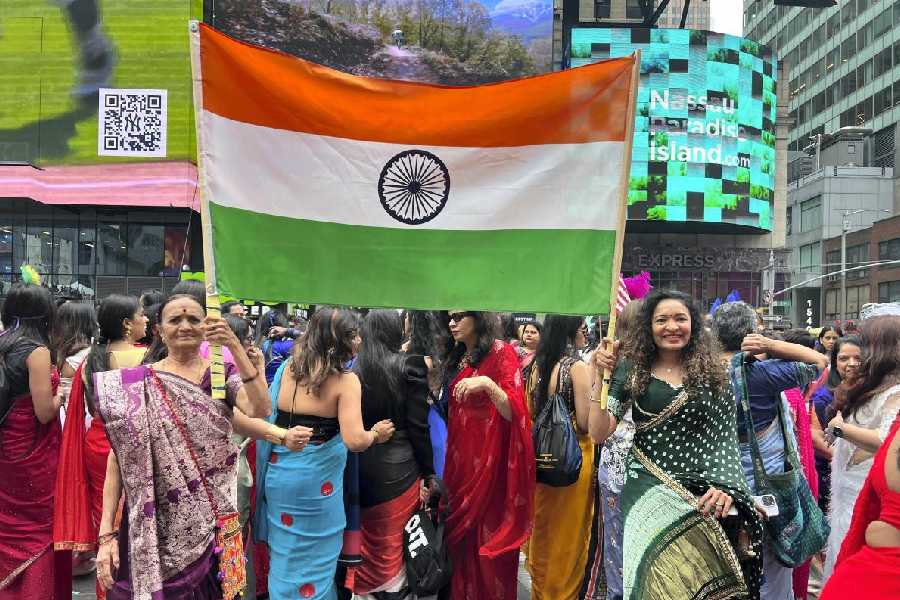
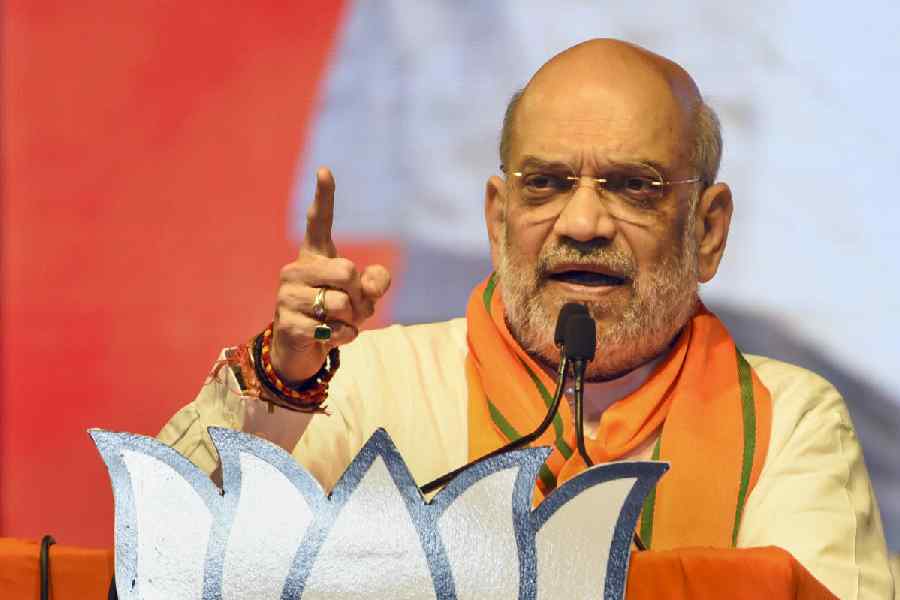
Intervening on social media, a chronicler of contemporary India recently complained that 'In fifty years of observing Indian elections I have never seen such vile and hate-filled rhetoric'
SWAPAN DASGUPTA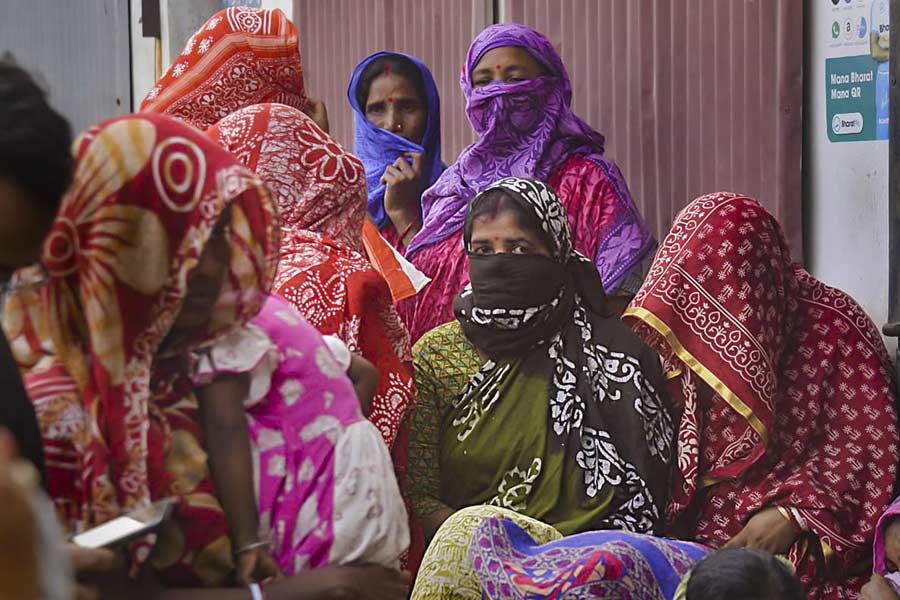
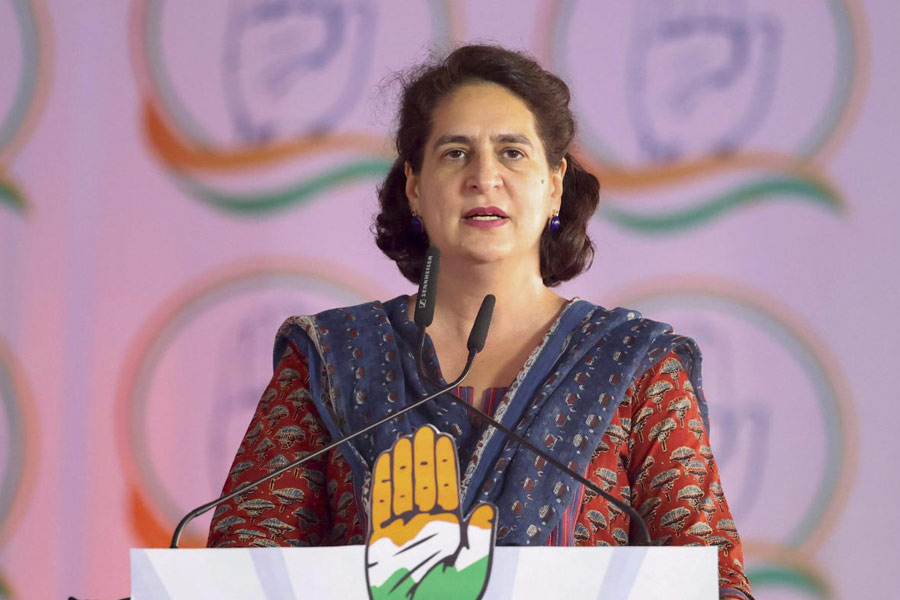
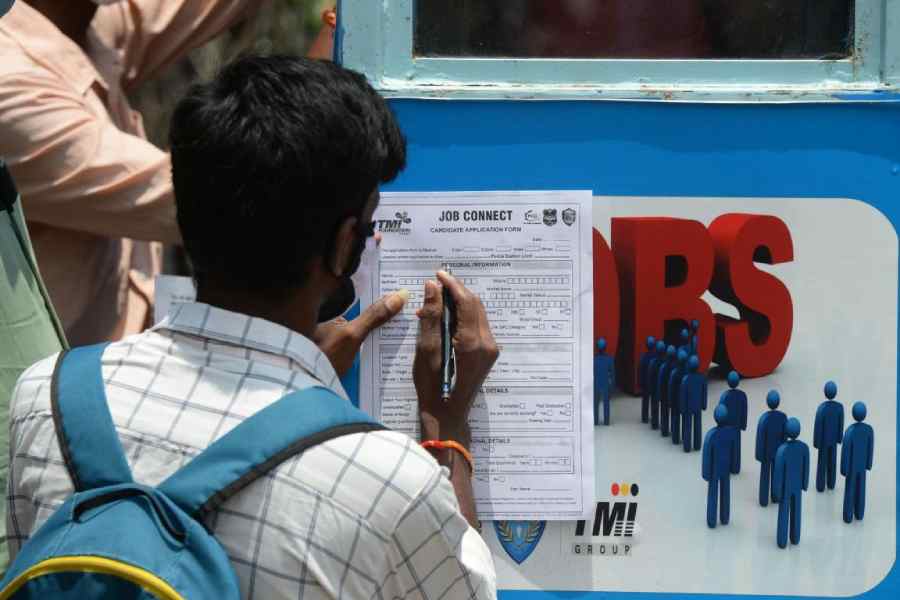
Intelligently devised welfare measures that assure amenities like healthcare, education & employment for women are a necessity in a deeply inequitable & patriarchal country like India
THE EDITORIAL BOARD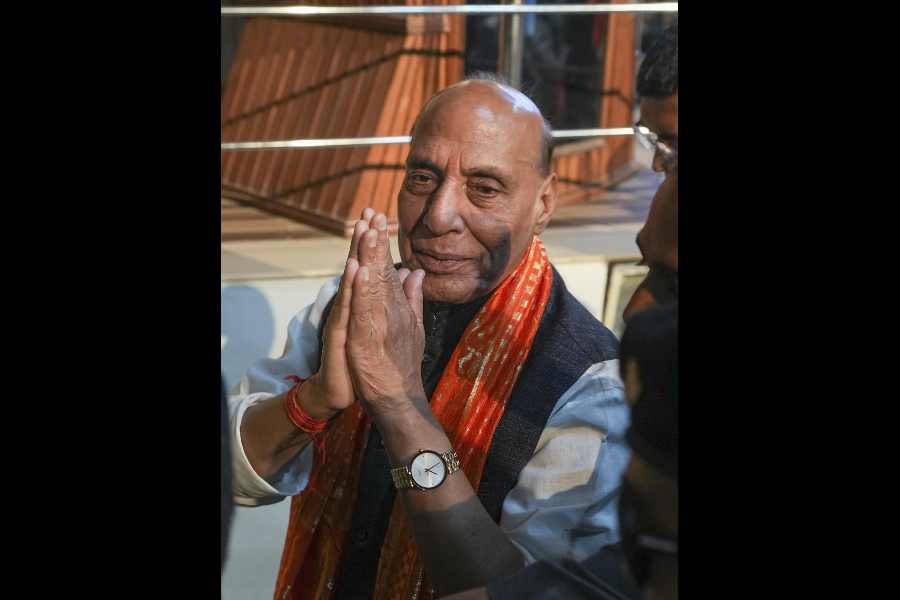


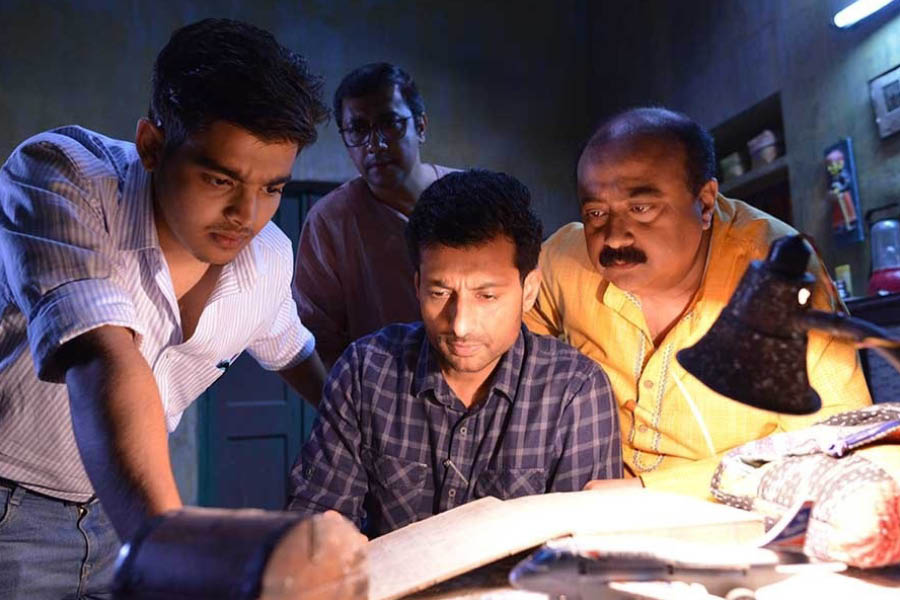
The Sandip Ray-directed film features Indraneil Sengupta, Ayush Das and Abhijit Guha as Feluda, Topshe and Jatayu, respectively