


JLo partners with AI for an upcoming action flick
Jackky and Rakul had an unforgettable experience at the Parliament of India
Jonty remembers his travel experiences in India on his daughter’s 9th b’day
This summer, chill like Kiara Advani
Ankytrixx set to headline the third edition of Gridlocked
For the man who plays minder to Rahul Gandhi on his overseas visits, the Western media coverage seemed to imply that Modi had lost the plot and was on the cusp of being perceived as a global pariah
SWAPAN DASGUPTA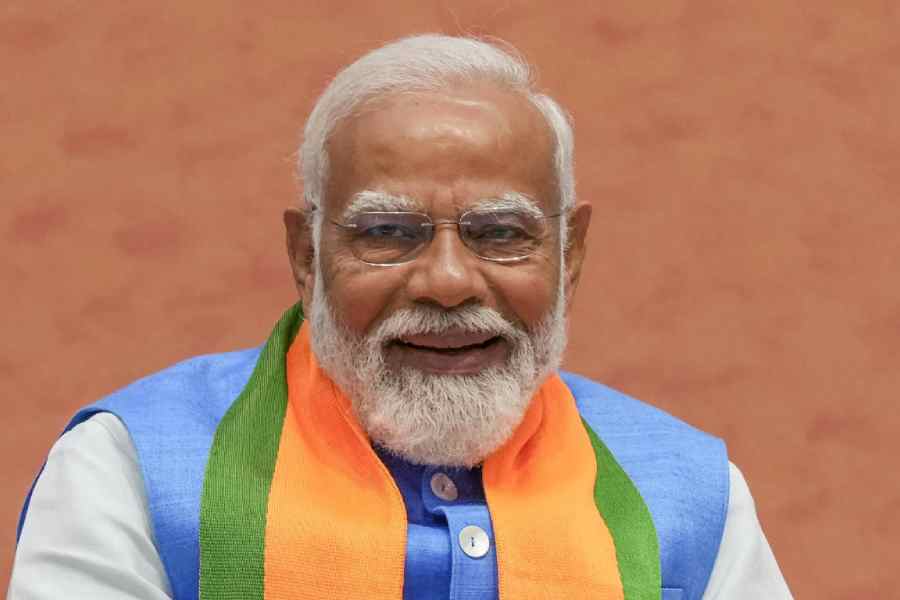

The fact that ‘working’ is as fluid a concept as gender needs to be focused in policymaking. This is because ‘work’ cannot be segregated in binary terms — private/public
SANHITA CHATTERJEE
Privilege may make one indifferent to assertions of identity & communal relationship, but marginality and fear of oppression are likelier to make one withhold or even hide such assertions
SAIKAT MAJUMDAR
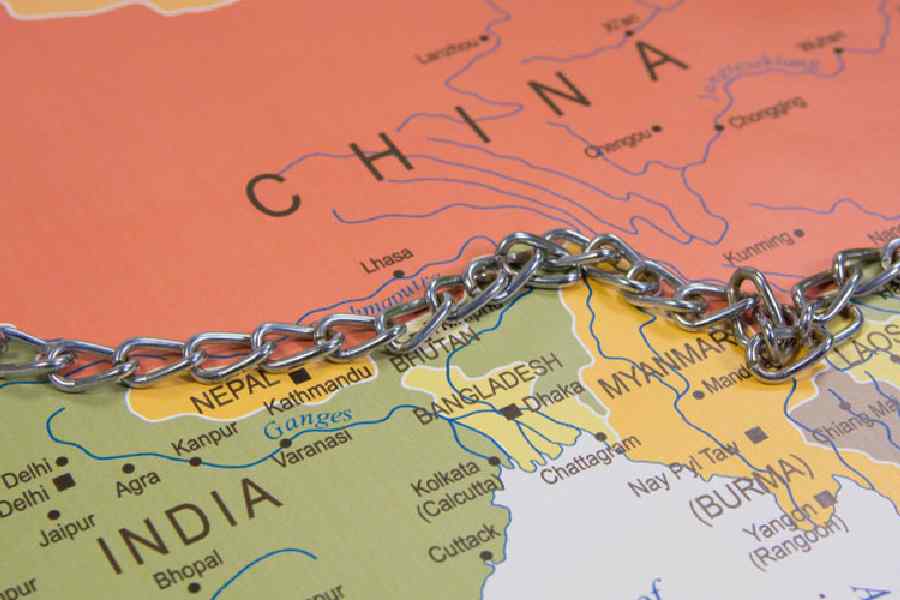
Now the geostrategic risks Muizzu took appear to have paid off. China knows that in Muizzu it has a partner who is in complete command in the Maldives, and who it can invest in
CHARU SUDAN KASTURI
Figure of predicted losses is six times more than what it would cost the world to reduce carbon emissions so as to keep the rise in temperatures to below 2° Celsius above pre-industrial levels
THE EDITORIAL BOARD


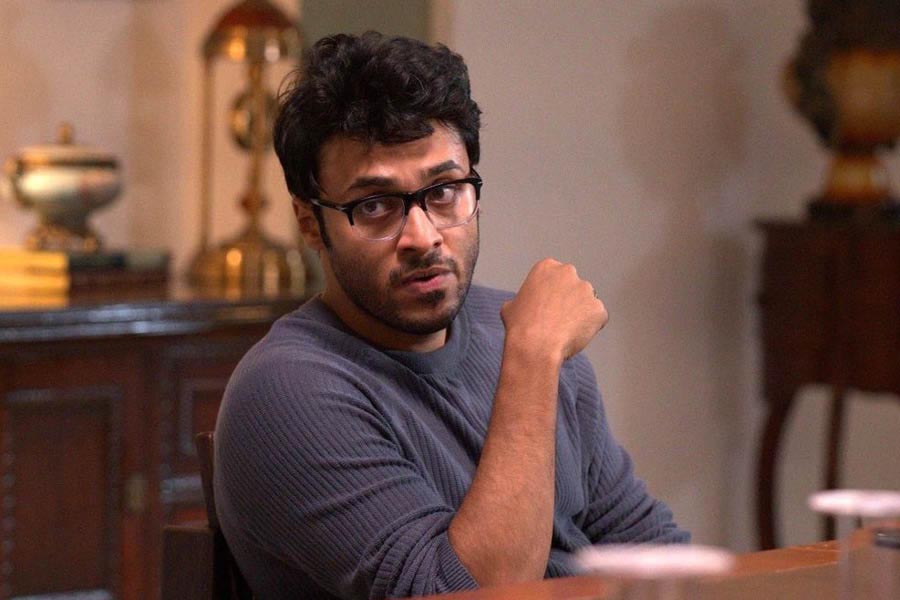
Soham will be seen in the Raj & DK web show Citadel: Honey Bunny and the film Sky Force alongside Akshay Kumar