


Planning a Turkish holiday? Anupam Roy has travel vignettes to share
Have you seen this Korean performance of ‘Phule Phule Dhole Dhole’?
Biryani on your mind? Head to Club Verde for a sumptuous Biryani festival
The trailer of ‘A Part of You’ promises to make you ponder over life and death
Try your hand at floral painting at ‘Brush and Bloom’ at The Bhawanipur House
The current attempt by the American Right, therefore, is to change the nature of universities so that speaking the truth no longer remains their avowed objective
PRABHAT PATNAIK
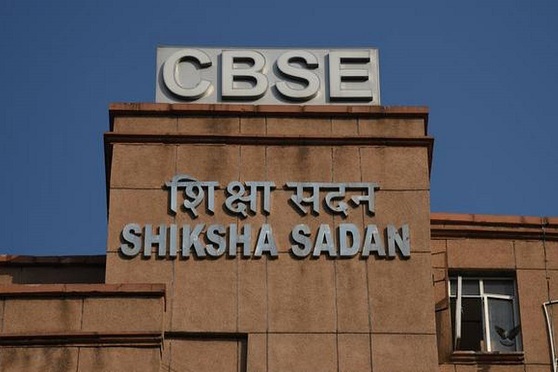
Science should be rational and unaffected by political interests. Scientists should work with integrity and shouldn’t distort scientific results to please the political elite
BIJU DHARMAPALAN
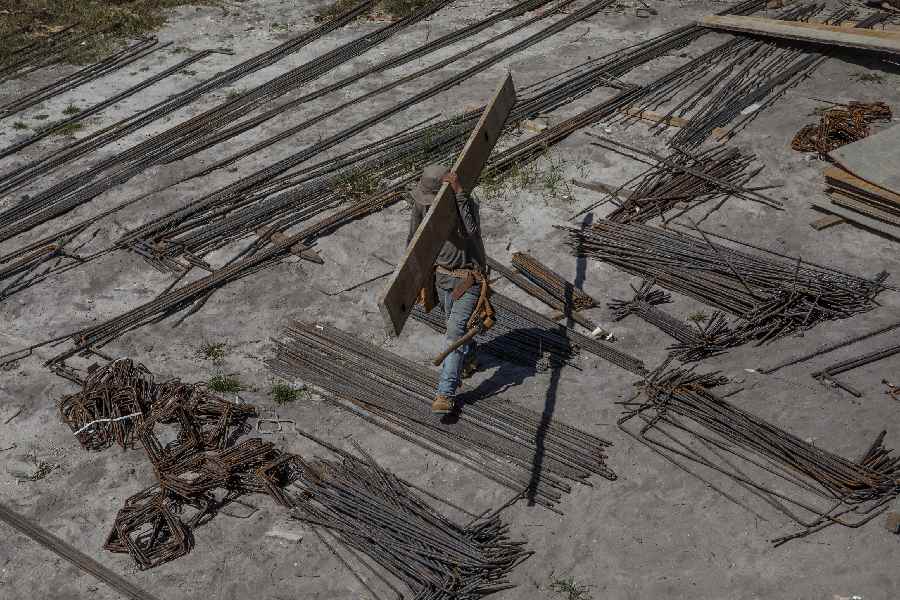
Israel is not the only country where Indian workers face dire working situations. Exploitation of Indian workers under conditions akin to slavery in Singapore & Gulf states has been a long-standing issue
CAROL SCHAEFFER
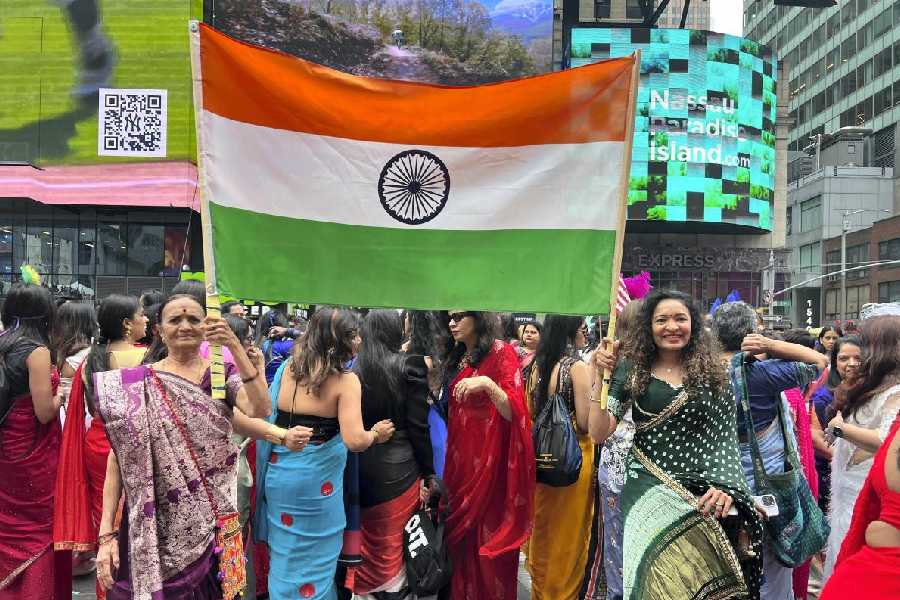
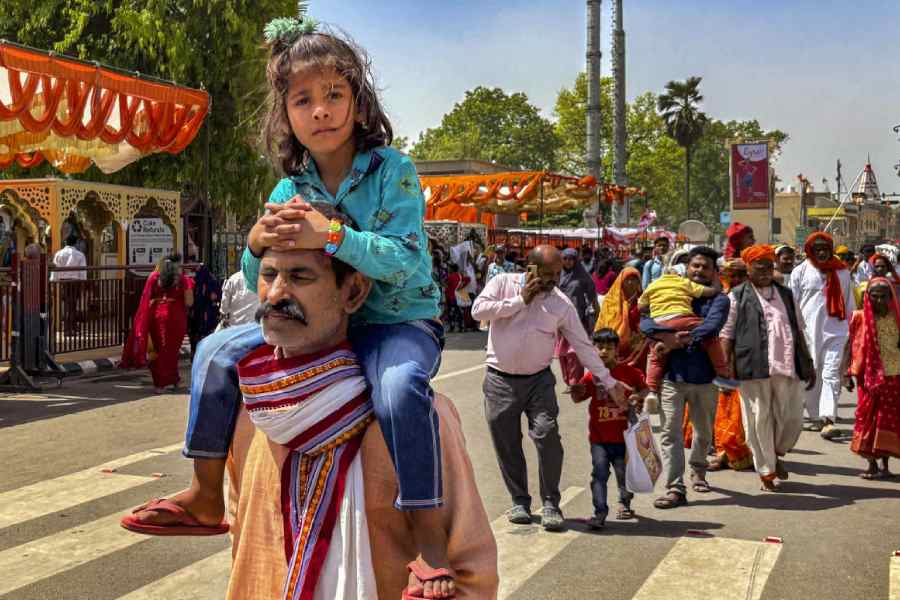
The inclusionary spirit of nation-building was distilled in the Constitution that directs the State to protect equality and non-discrimination that nurture the nation’s diversity
SUHIT K. SEN
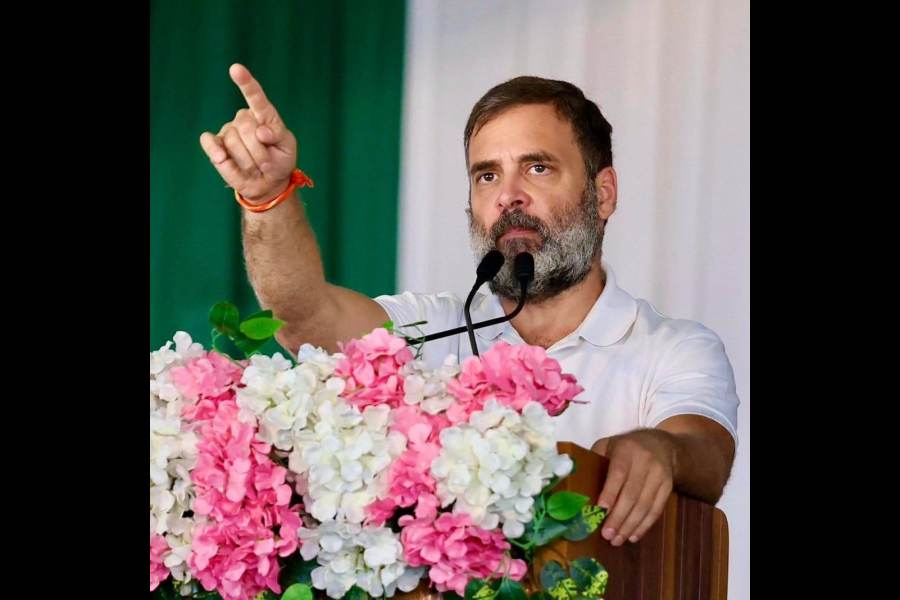
Rahul’s shift to Wayanad did create ripple effects for Congress, especially in Karnataka & Telangana assembly polls. Congress would hope to generate something similar in the north
THE EDITORIAL BOARD


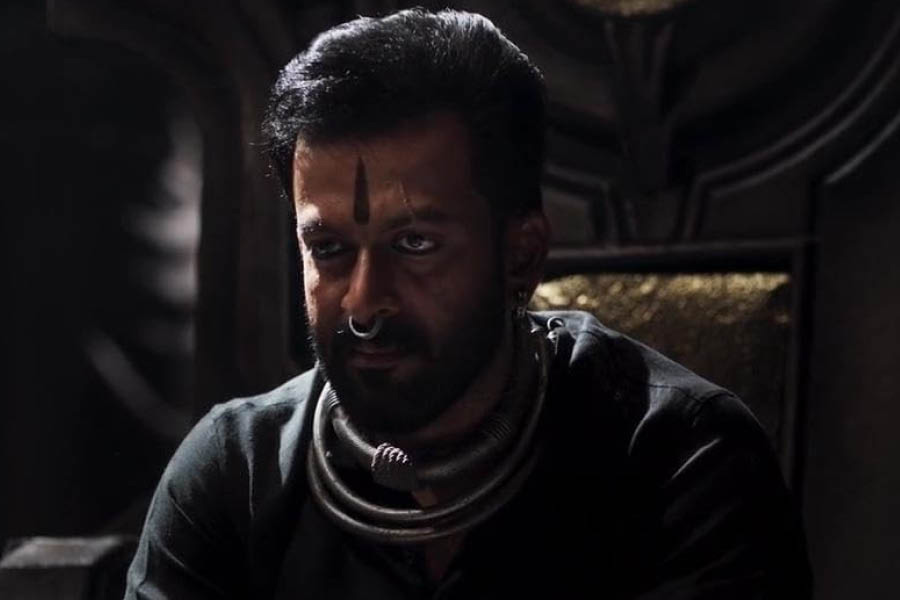
Headlined by Prabhas, Salaar: Part 1 – Ceasefire amassed Rs 617 crore gross at the worldwide box office