


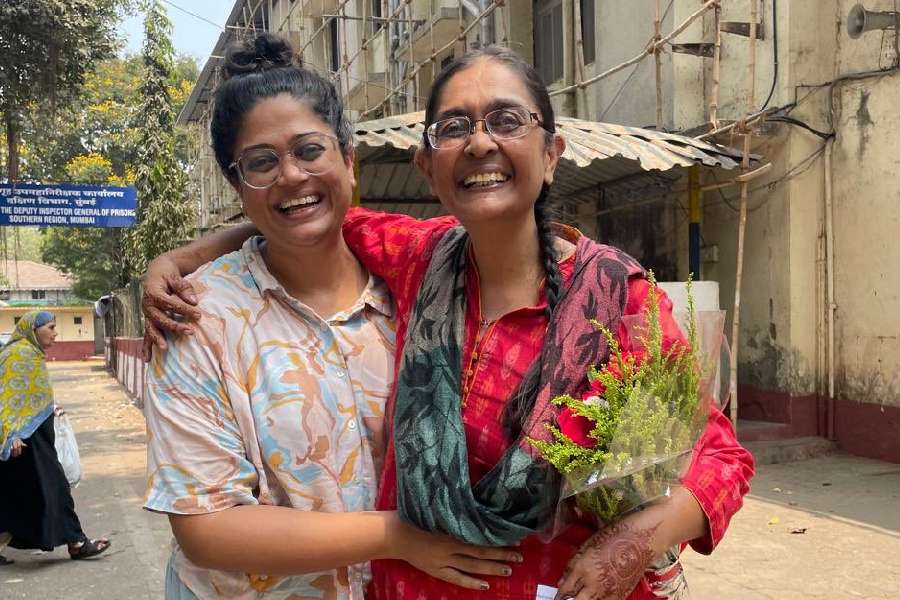


Surangana and Riddhi celebrate 9 years of love and friendship
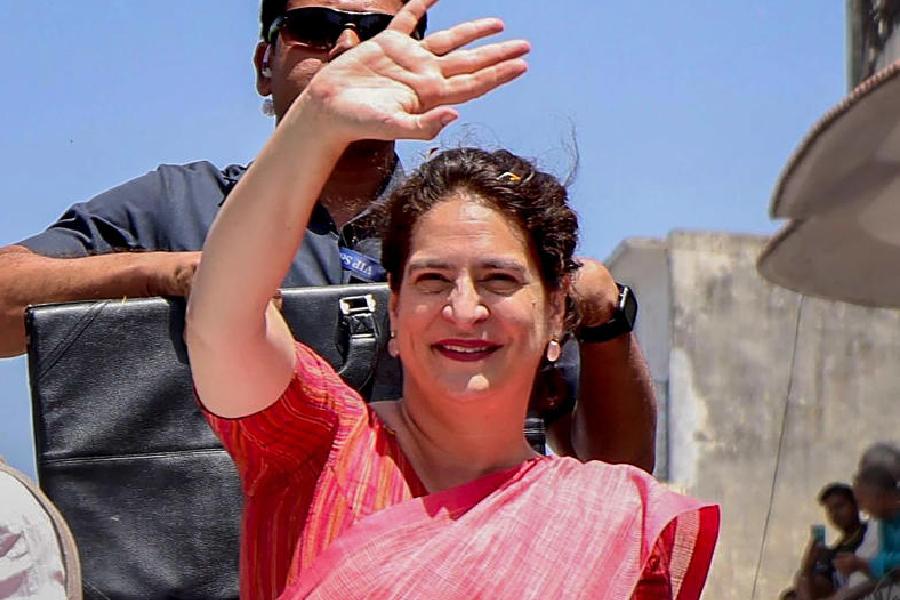
Priyanka Chopra Jonas aces no-makeup look for work
Tota Roy Choudhury shows off some new dance steps on Instagram
Hoichoi’s mega announcement ushering in the Bengali New Year
Coke Studio Bangla Season 3 celebrates Bangladesh’s textile artisans
When the trajectories of languages get snapped, the accumulated wisdom in those languages, too, gets submerged and continues to survive in severely truncated, irreparable and insensible forms
G.N. DEVY
The manipulation of brain activity has also been around for some time now and has been ramped up with Artificial Intelligence-based ‘interventions’
PRAMOD K. NAYAR
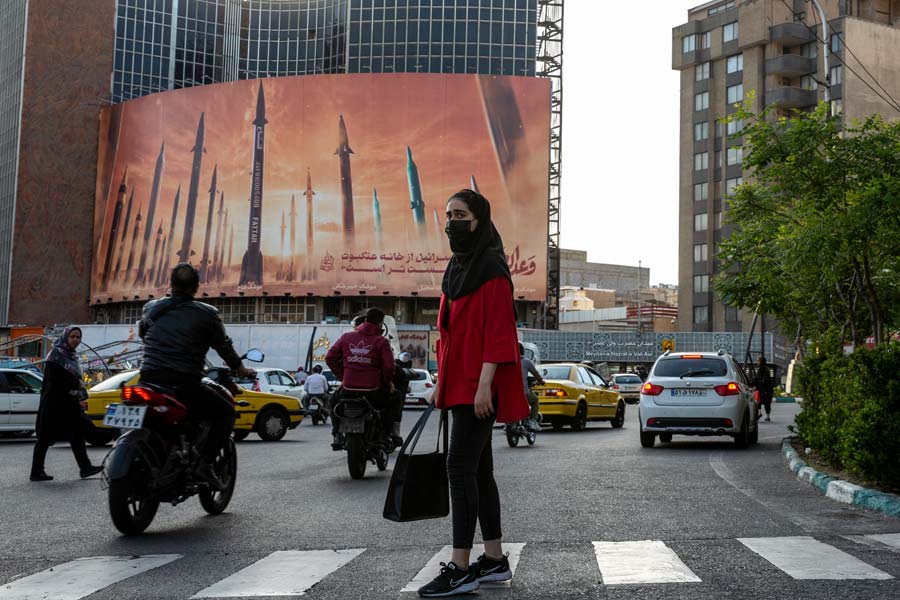
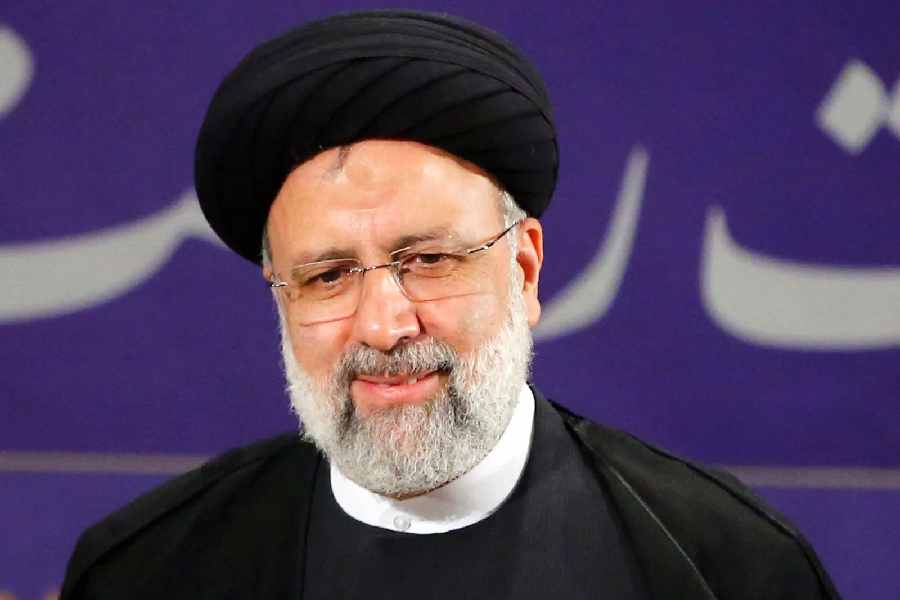
Shortly after the missile strike, President Ebrahim Raisi of Iran issued a statement declaring that the Revolutionary Guard had “taught a lesson to the Zionist enemy”
THOMAS L. FRIEDMAN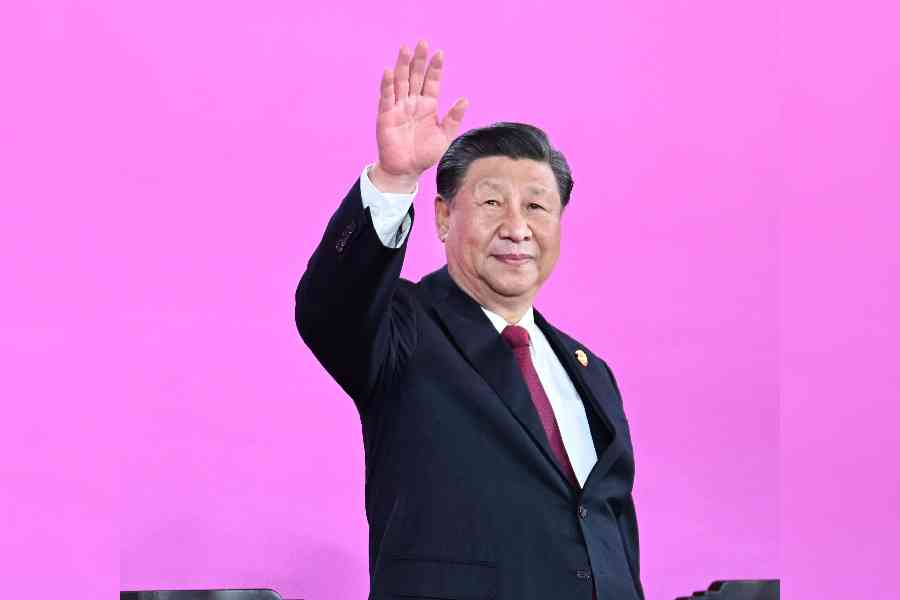
China continues to warn regional players of negative consequences of their actions. Yet, it is Beijing’s own behaviour that is reshaping the Indo-Pacific landscape
HARSH V. PANT
Equality and uniformity are not identical, neither is equality an excuse to stifle all beneficent personal laws of minority communities, even when they protect women
THE EDITORIAL BOARD


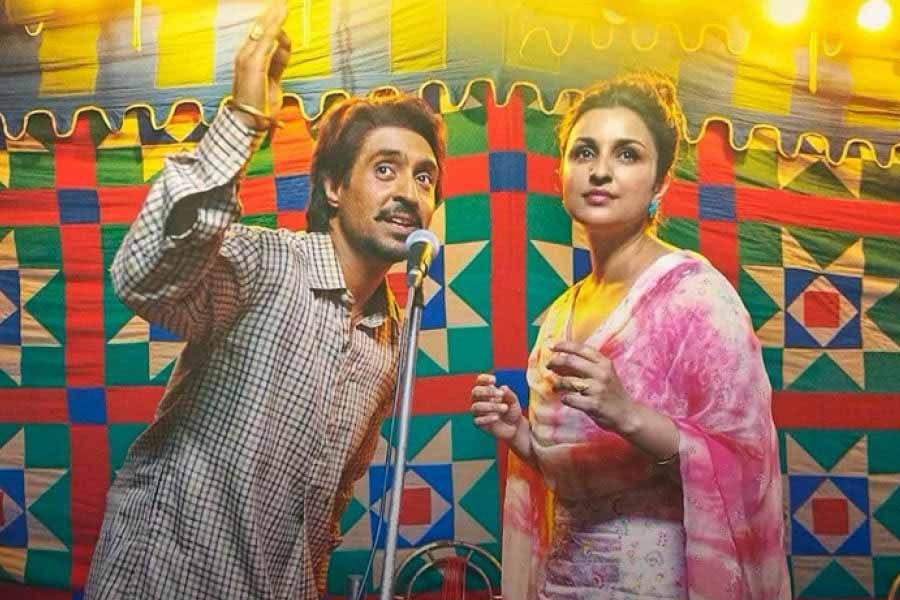
Diljit Dosanjh plays the titular role in this biopic while Parineeti Chopra plays his wife Amarjot