


‘One Hundred Years of Solitude’ is coming on Netflix
Paoli Dam shares her favourite Hindi word in new Instagram reel
Enjoy the Lucknowi food fest at Barbeque Nation
Don’t let the kids miss the Summer Camp at Jhore Jole Jongole Eco Heritage Resort
Drop by at Shuffling Suitcases store that’s set to host handmade apparel brand, Okhai
Notwithstanding a repeated history of strikes and counterstrikes as part of the shadow war between Israel and Iran, an attack from an aircraft on a diplomatic building is unusual
T.C.A. RAGHAVAN

Arunachal Pradesh is replete with unemployment, lack of roads and drinking water, poor literacy (four candidates are illiterate crorepatis) and negligible representation of women
SUDIPTA BHATTACHARJEE
The 1990s was a watershed era. A new entity called non-government organisation emerged at the grassroots level which redefined the nature of non-party political formations
HILAL AHMED
Last rites and rituals are the last to change. My conversations with ritual specialists reveal that some changes are taking place. We are exploring greener cremation systems
MINAKSHI DEWAN
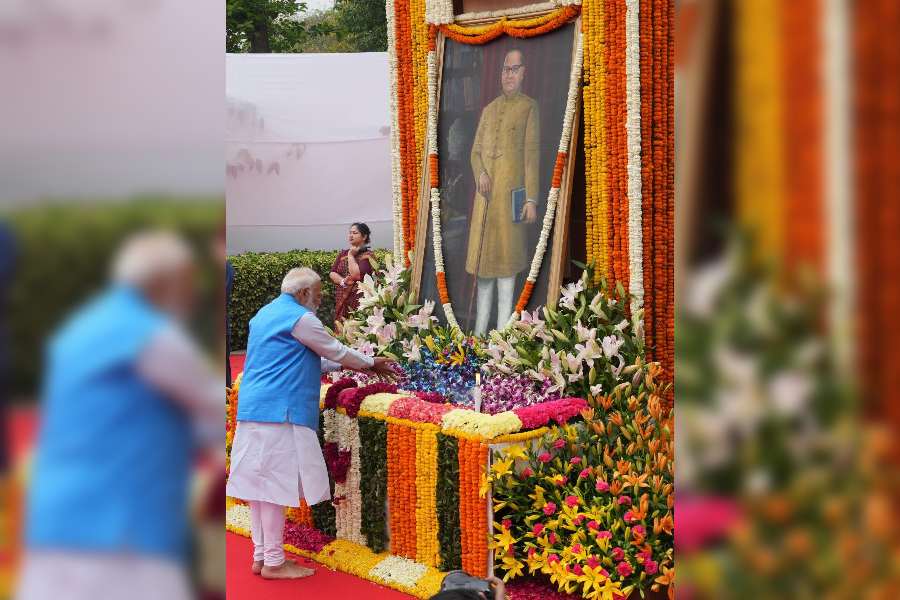
An objective measure of the gap between Mr Modi’s word and deed when it comes to upholding constitutional values could be a reliable indicator of the nature of the prime minister’s guarantees
THE EDITORIAL BOARD


The actor-couple, who tied the knot on January 27 last year, reportedly started dating in 2020 after meeting on the sets of Masaba Masaba