


Glen Powell and Daisy Edgar-Jones chase twin tornadoes in action-packed ‘Twisters’
Check out Ranbir Kapoor’s suave transformation by Aalim Hakim
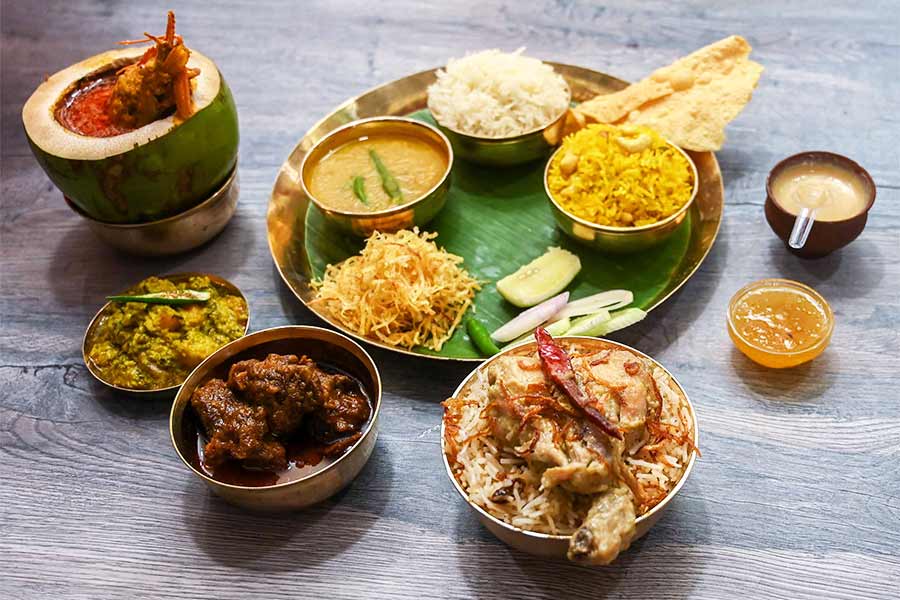
Kolkata biryani Vs other biryanis — the battle continues…
Add Rupleena Bose’s ‘Summer of Then’ to your June reading list
Experience Tenzing Dakpa’s solo exhibition ‘Weather Report’
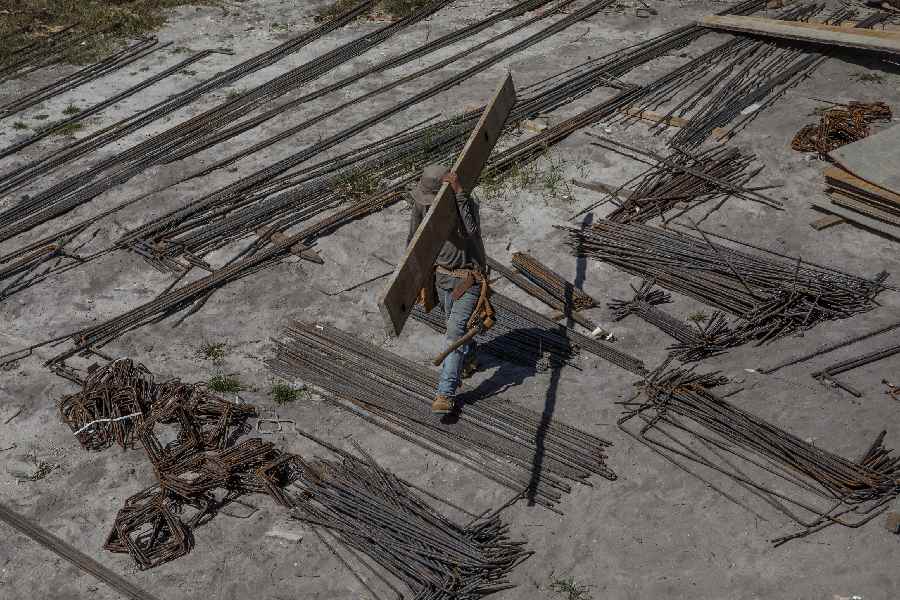
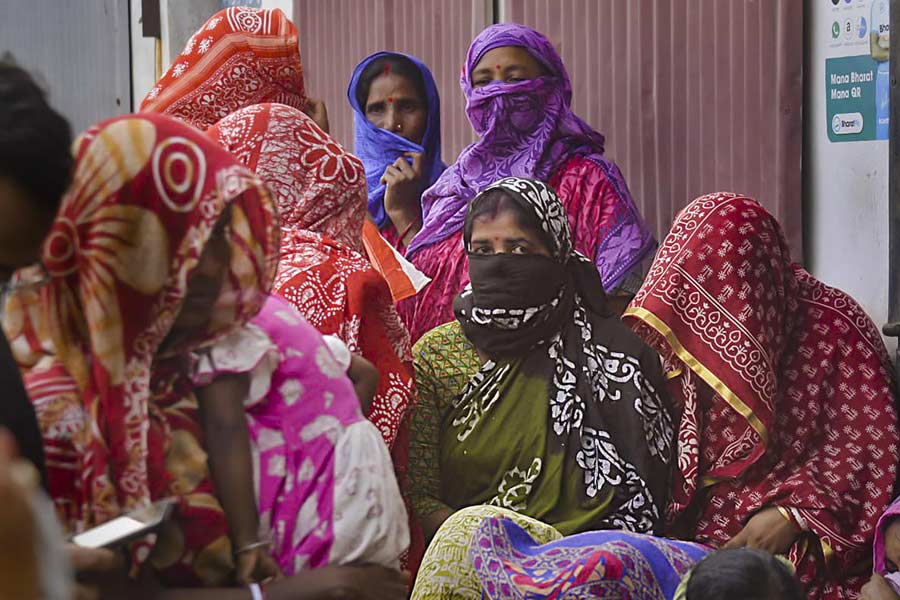
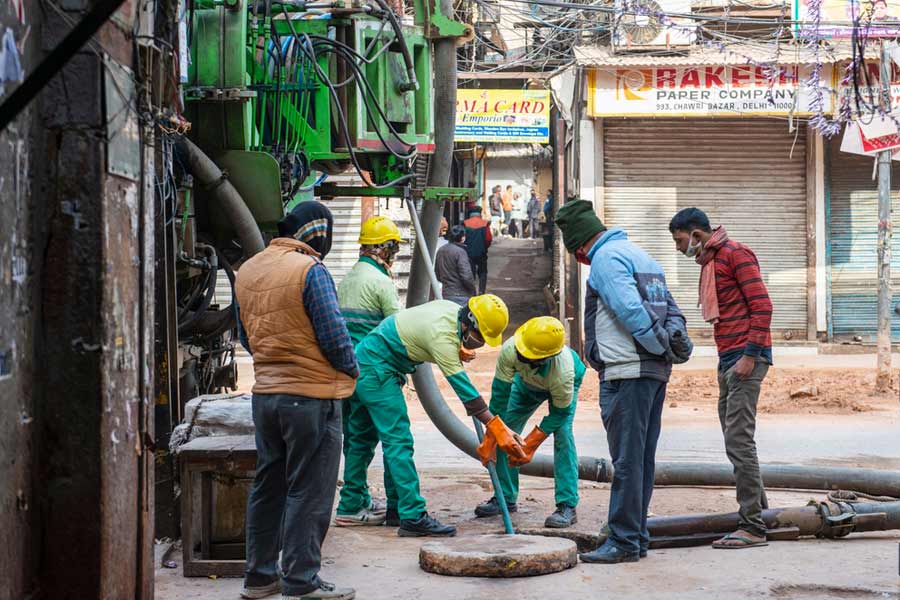
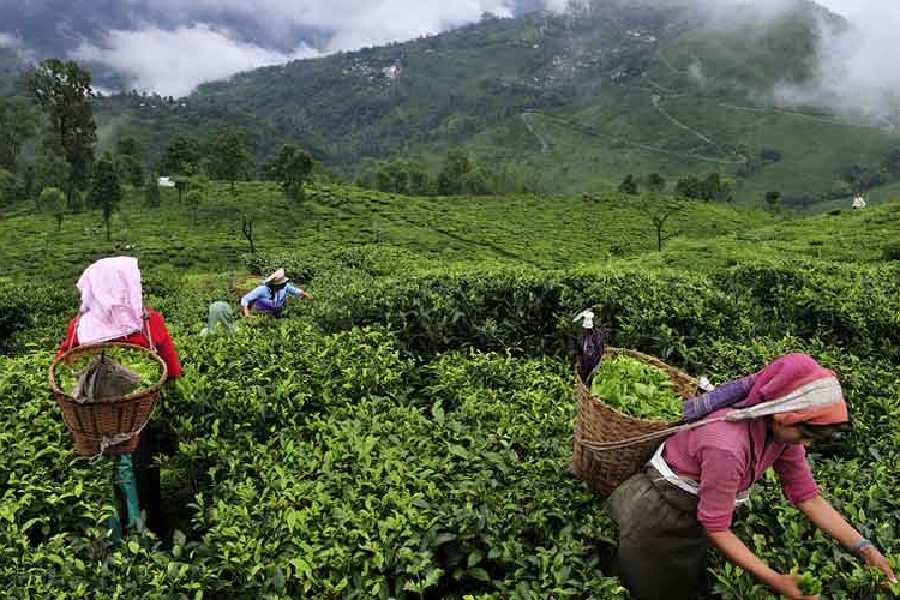
In India, there is another terrifying phenomenon now: millions are so fed up with looking for a job that they have stopped looking and have exited the workforce
R. RAJAGOPAL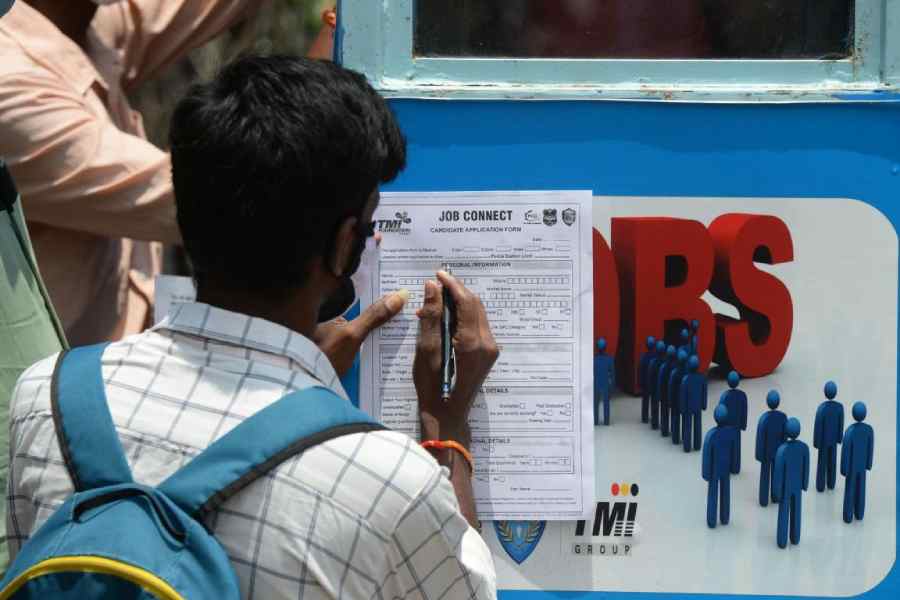
FRA seems to be a crucial issue in many constituencies — most acutely in states like Jharkhand, Madhya Pradesh and Odisha — that are going to the polls in the remaining phases of the elections
JAIDEEP HARDIKAR
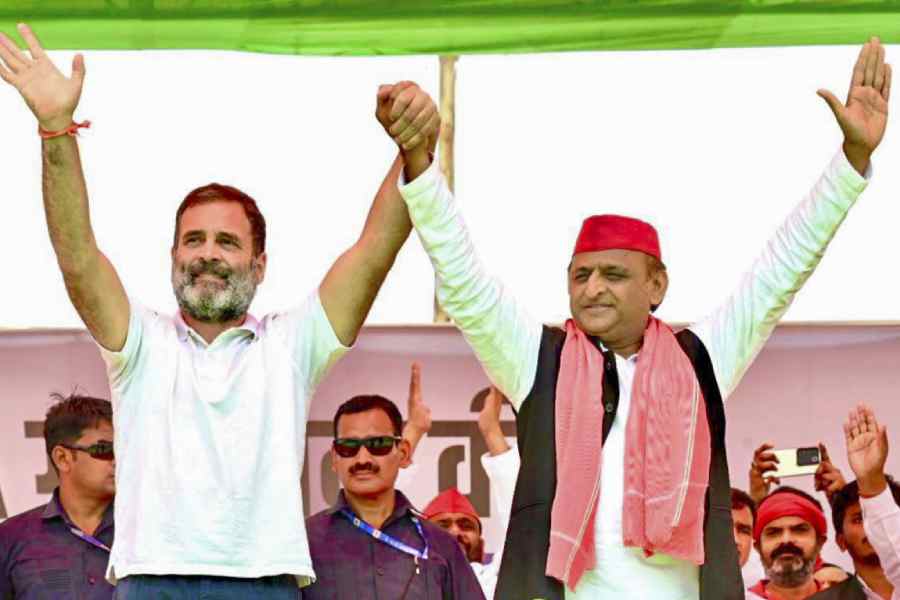
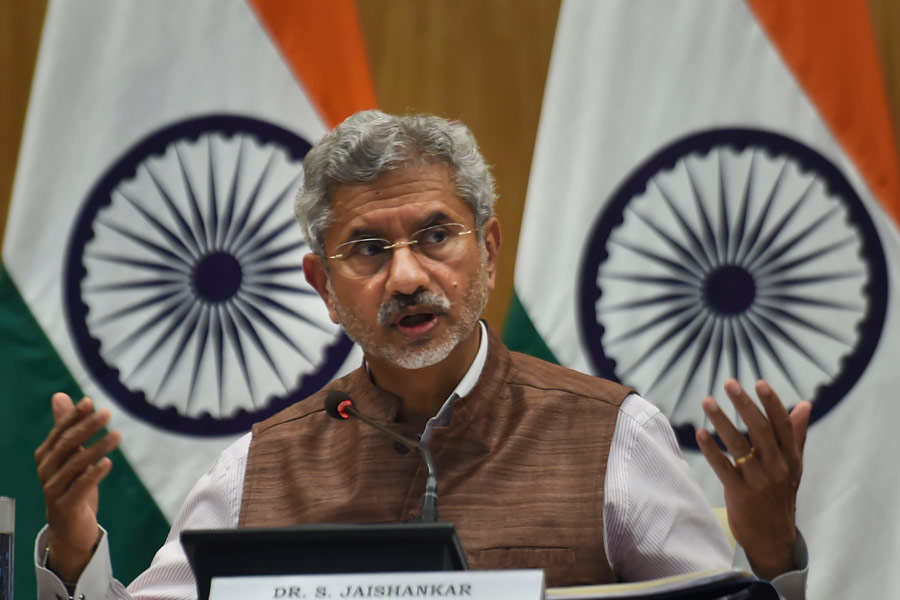
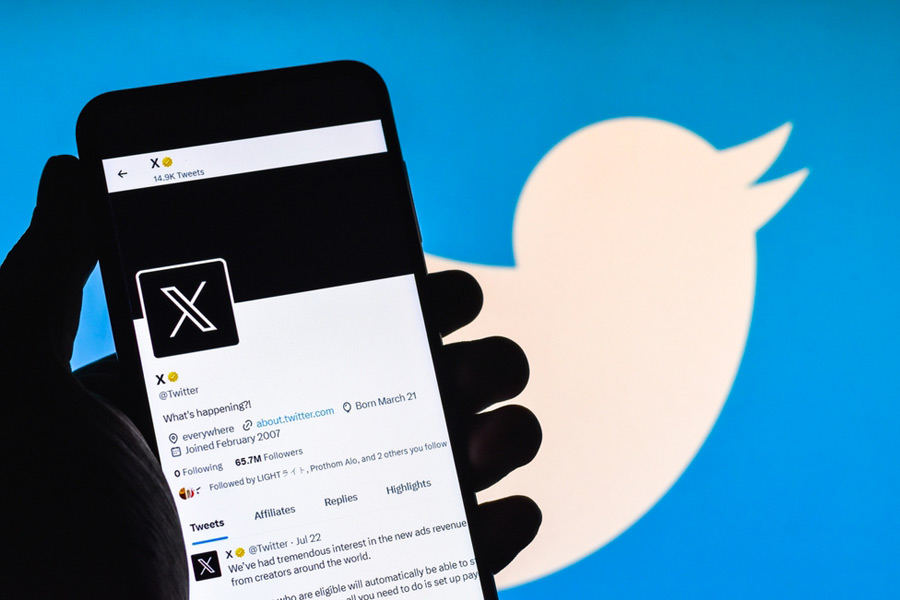
Intervening on social media, a chronicler of contemporary India recently complained that 'In fifty years of observing Indian elections I have never seen such vile and hate-filled rhetoric'
SWAPAN DASGUPTA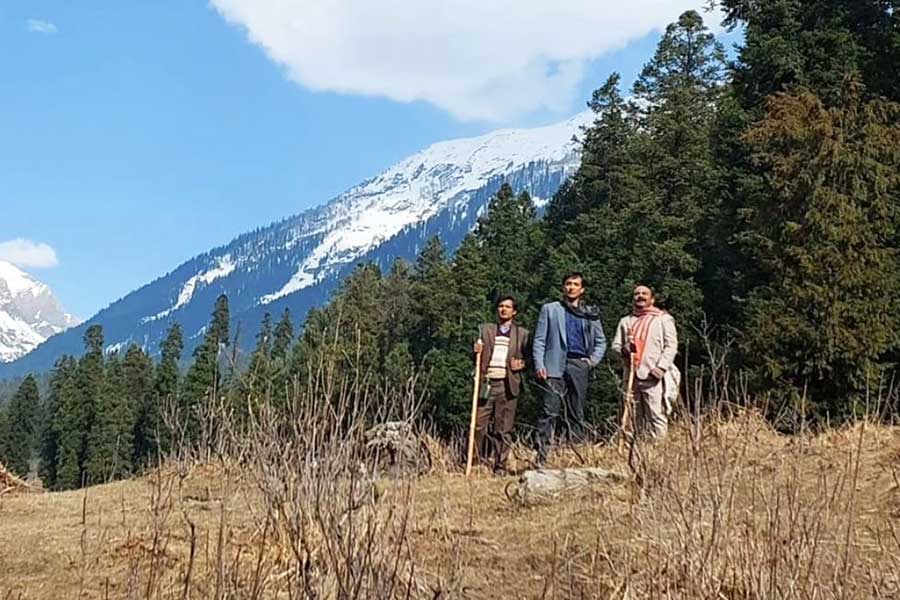
Travel writing was historically a lowbrow genre, both in terms of financial success & academic respectability, until two books appeared. One by Paul Theroux & the other by Paul Fussell
ABHISHEK CHATTERJEE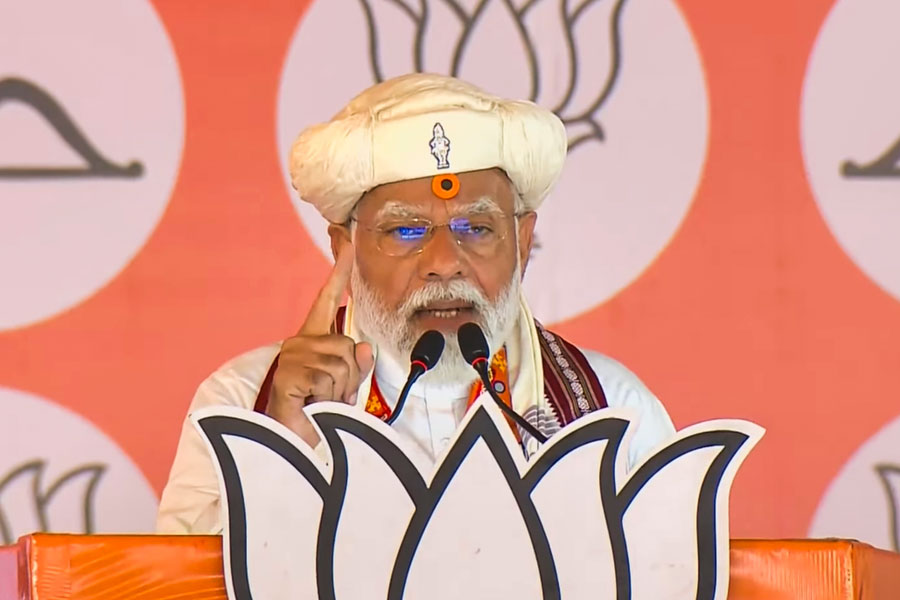
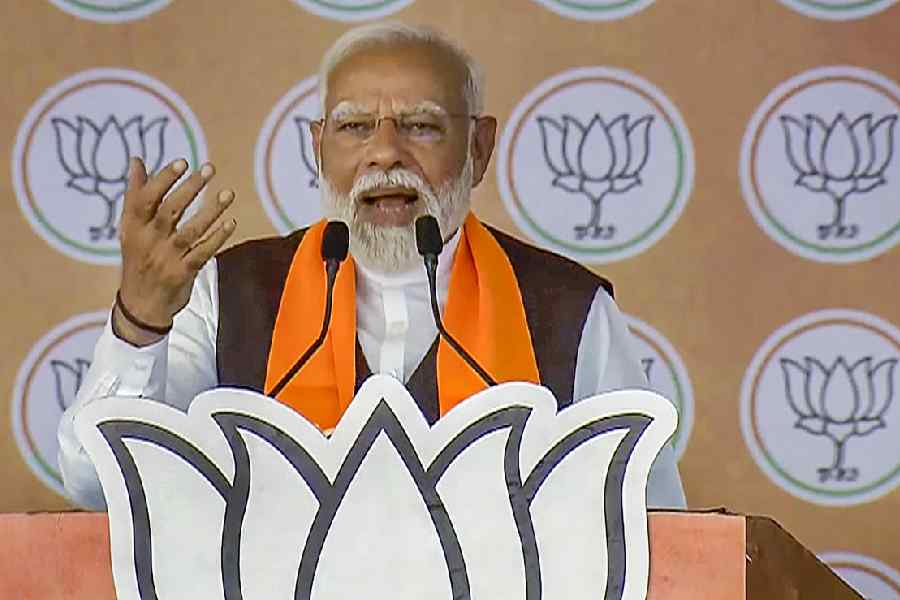
Mr Modi’s remark, however, reiterates an adage: that politics is shorn of permanent friends or foes. Yesterday’s patron — industrialist or otherwise — could well be today’s antagonist
THE EDITORIAL BOARD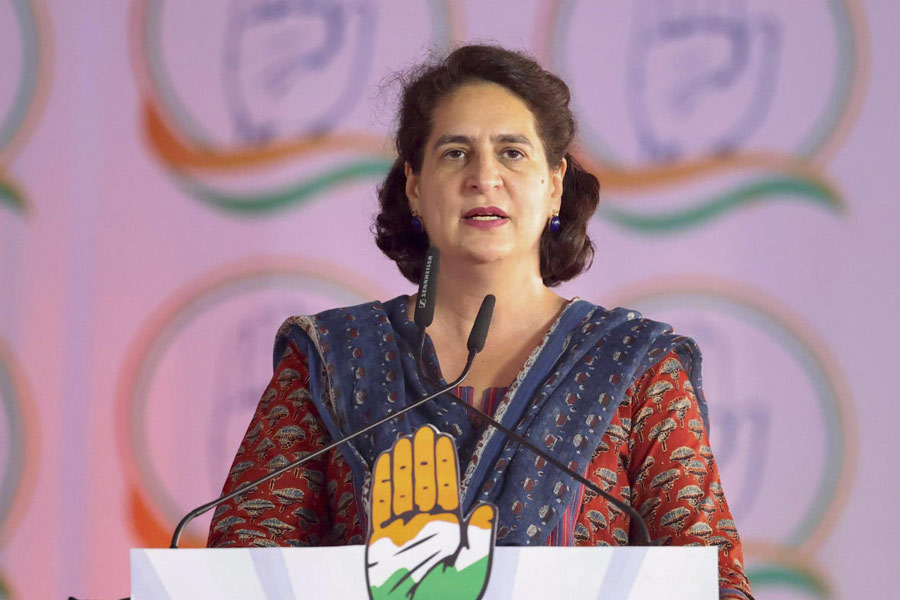


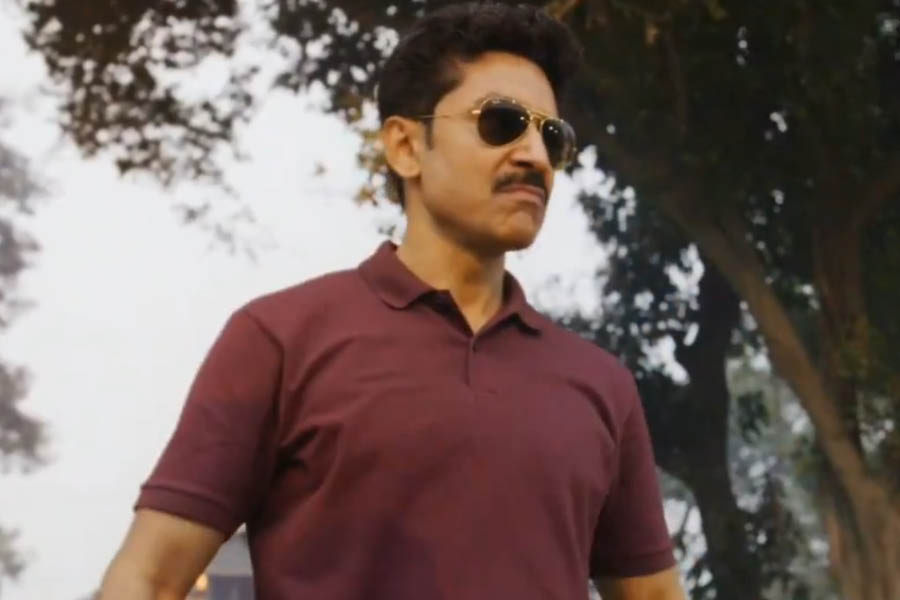
Co-created by Hansal Mehta and directed by his son Jai Mehta, Lootere is streaming on Disney+ Hotstar