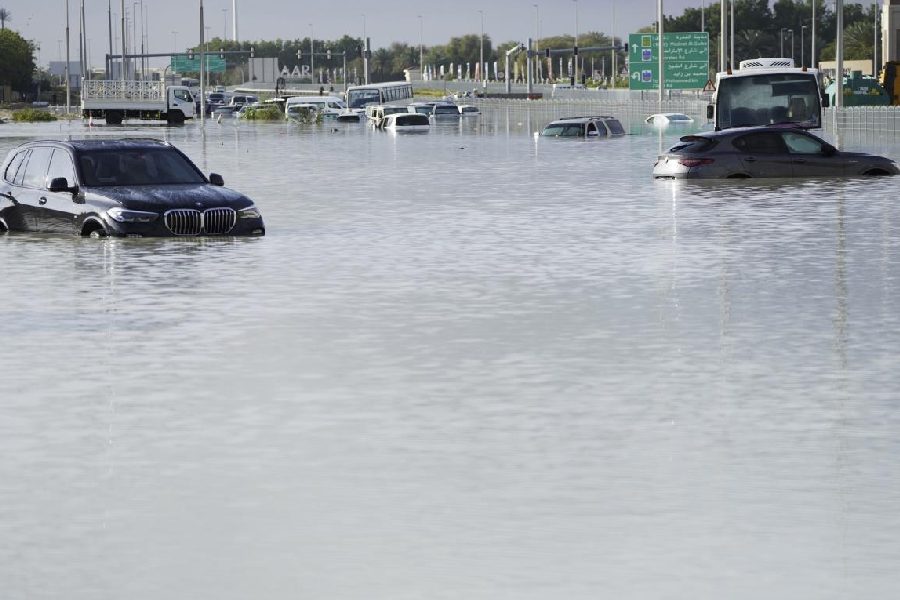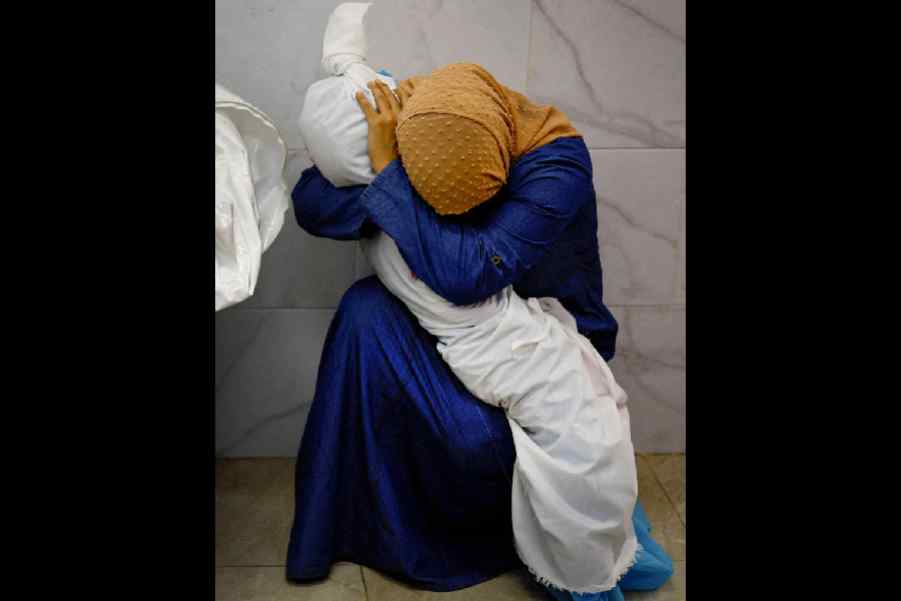

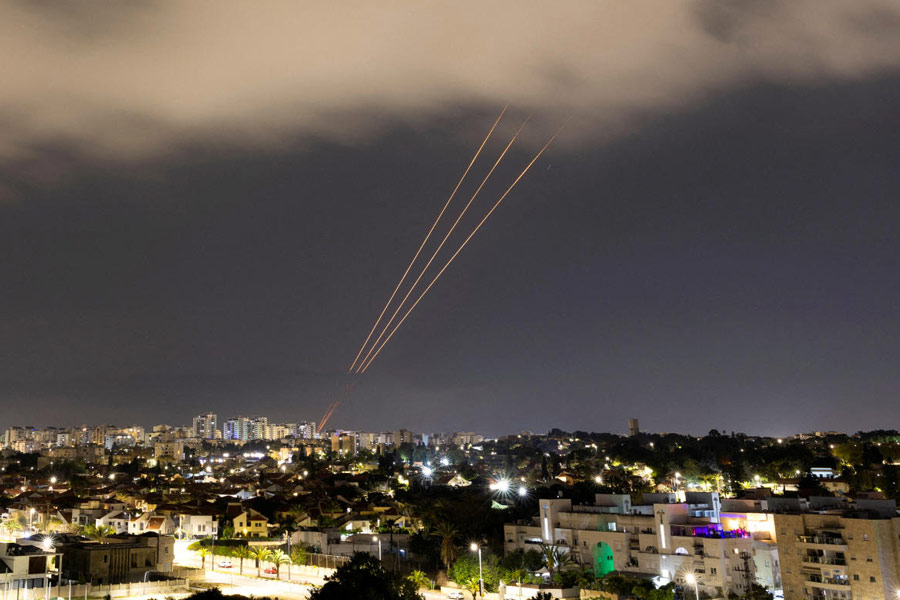


Notwithstanding a repeated history of strikes and counterstrikes as part of the shadow war between Israel and Iran, an attack from an aircraft on a diplomatic building is unusual
T.C.A. RAGHAVAN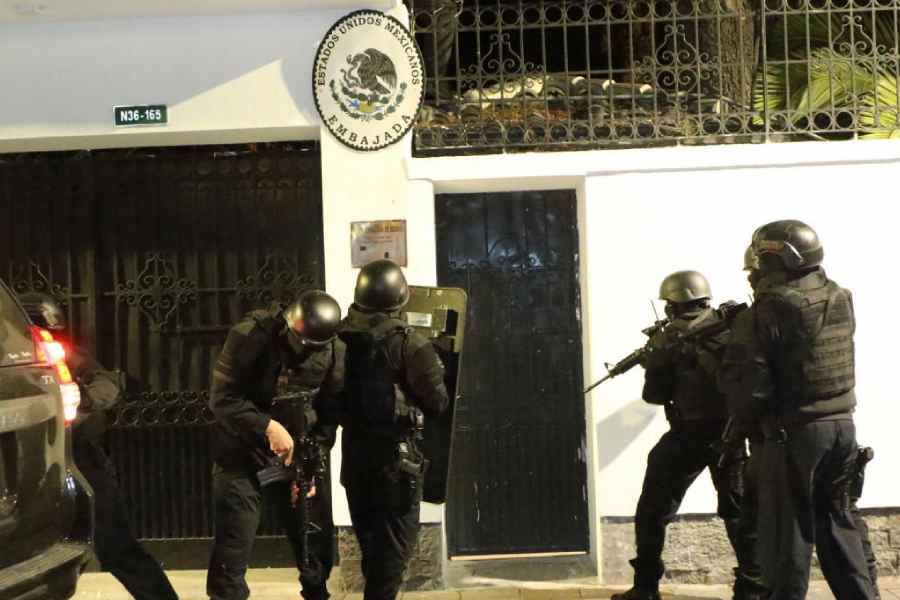

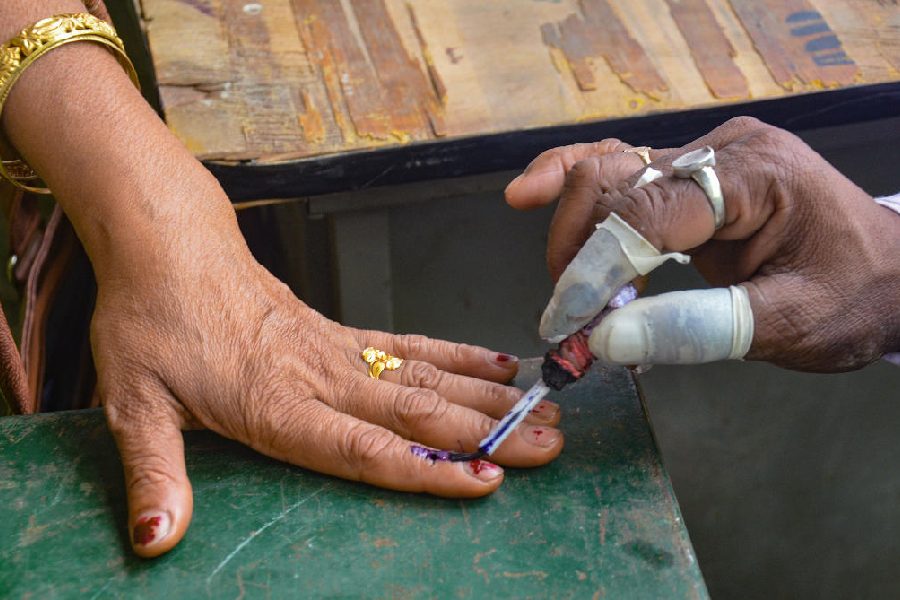
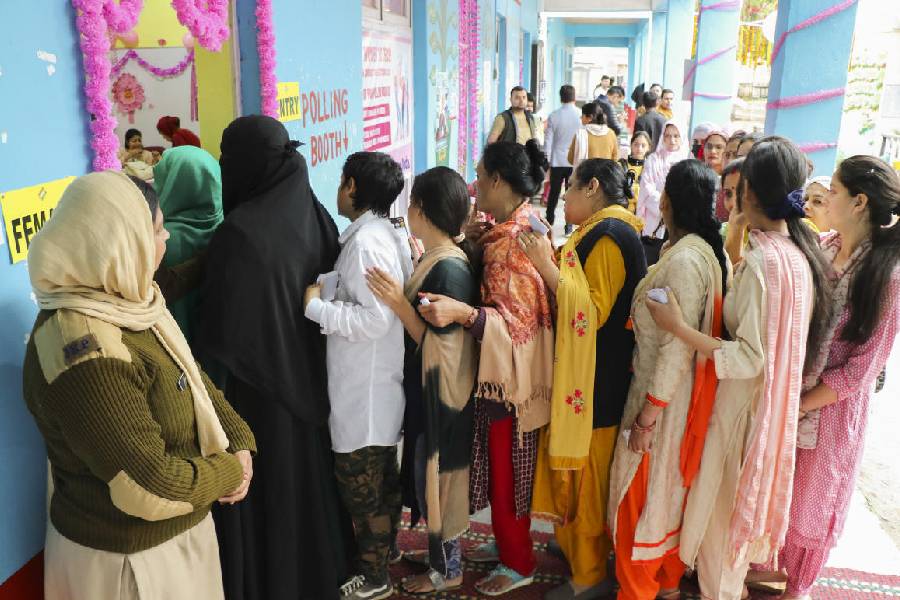
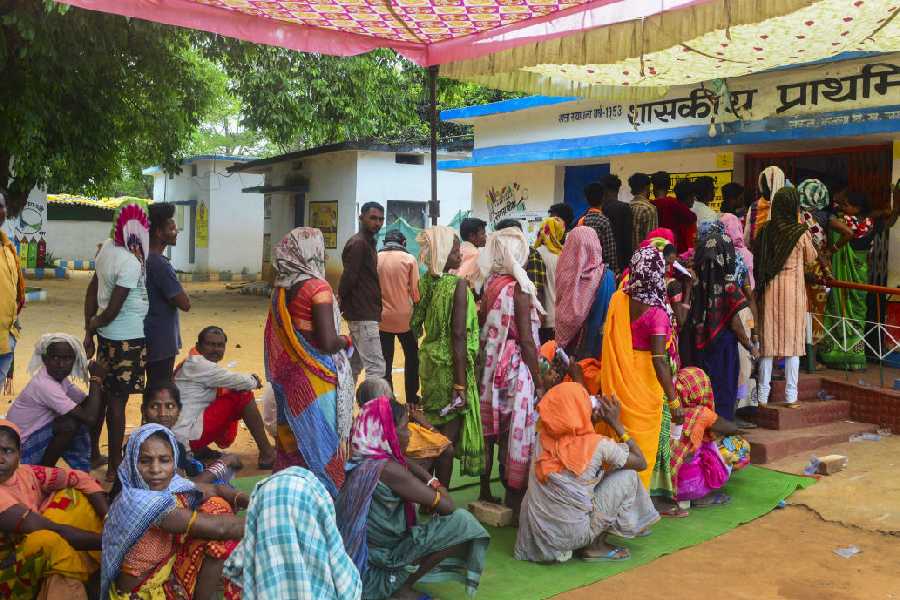
Arunachal Pradesh is replete with unemployment, lack of roads and drinking water, poor literacy (four candidates are illiterate crorepatis) and negligible representation of women
SUDIPTA BHATTACHARJEE
The 1990s was a watershed era. A new entity called non-government organisation emerged at the grassroots level which redefined the nature of non-party political formations
HILAL AHMED
Last rites and rituals are the last to change. My conversations with ritual specialists reveal that some changes are taking place. We are exploring greener cremation systems
MINAKSHI DEWAN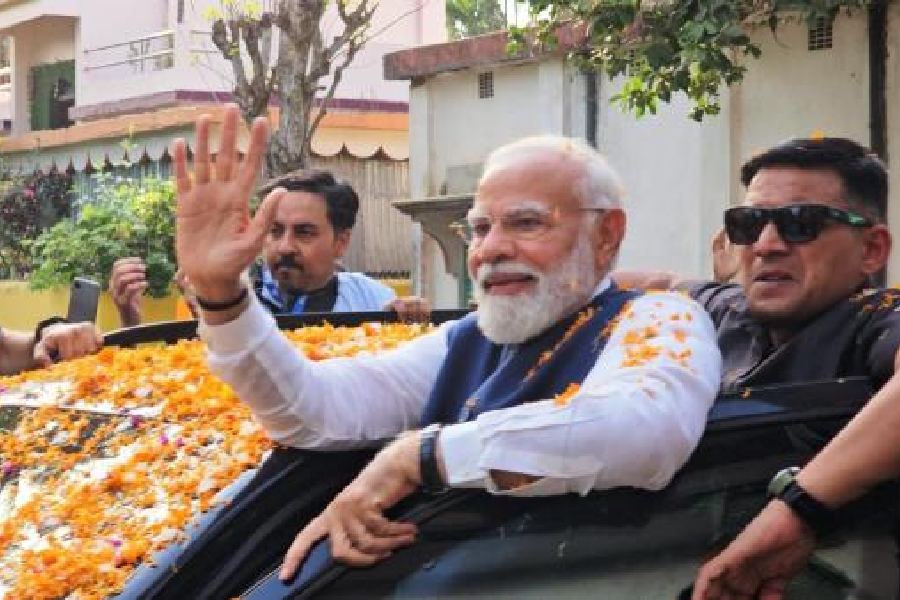
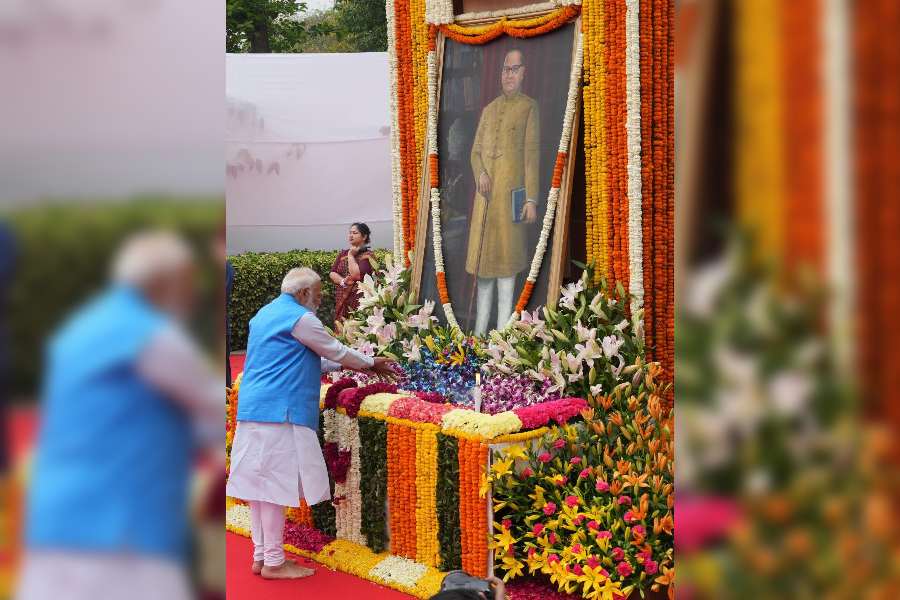
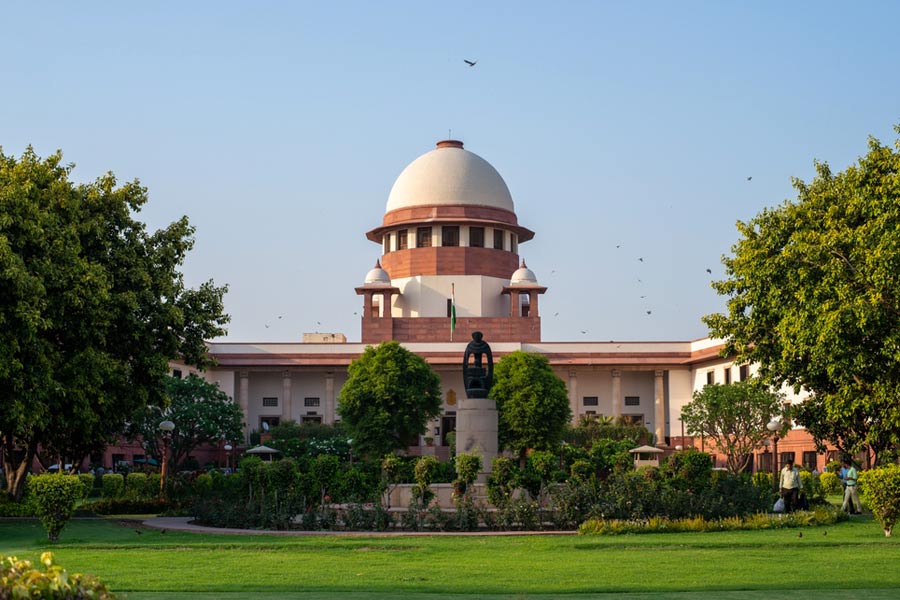
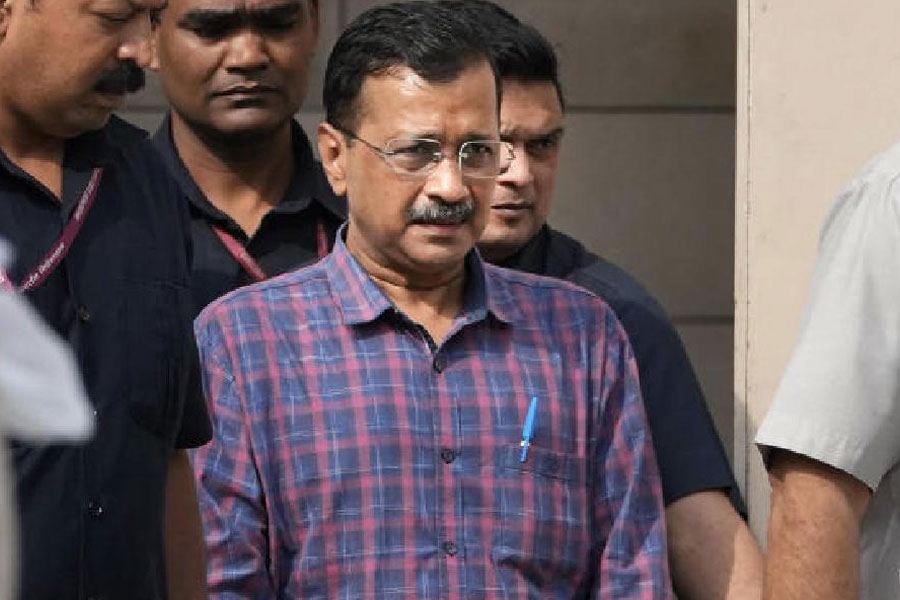
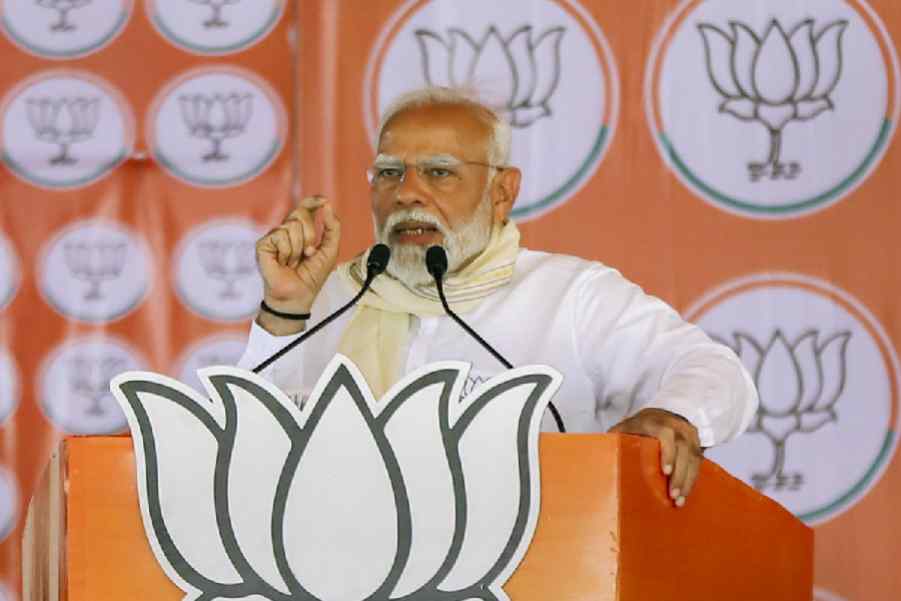
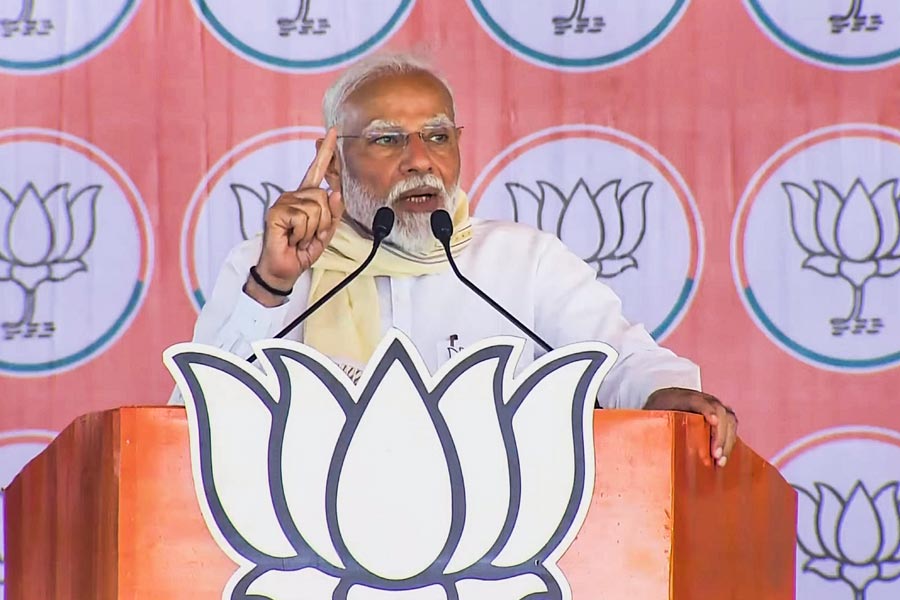
An objective measure of the gap between Mr Modi’s word and deed when it comes to upholding constitutional values could be a reliable indicator of the nature of the prime minister’s guarantees
THE EDITORIAL BOARD


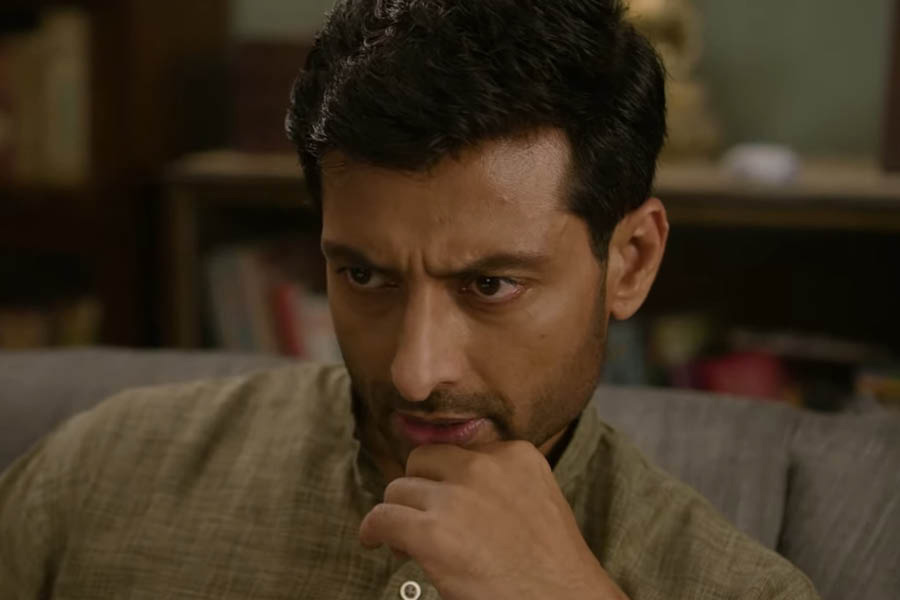
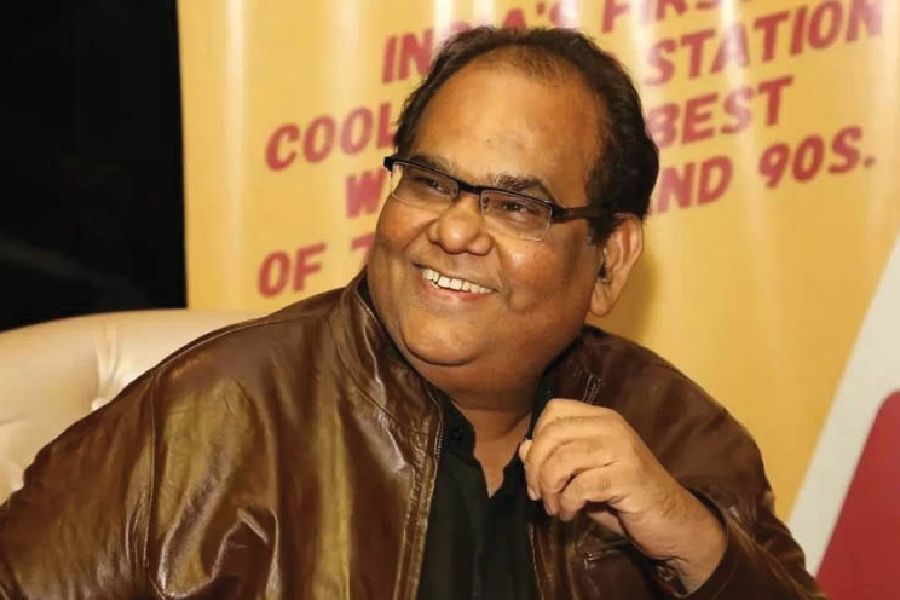
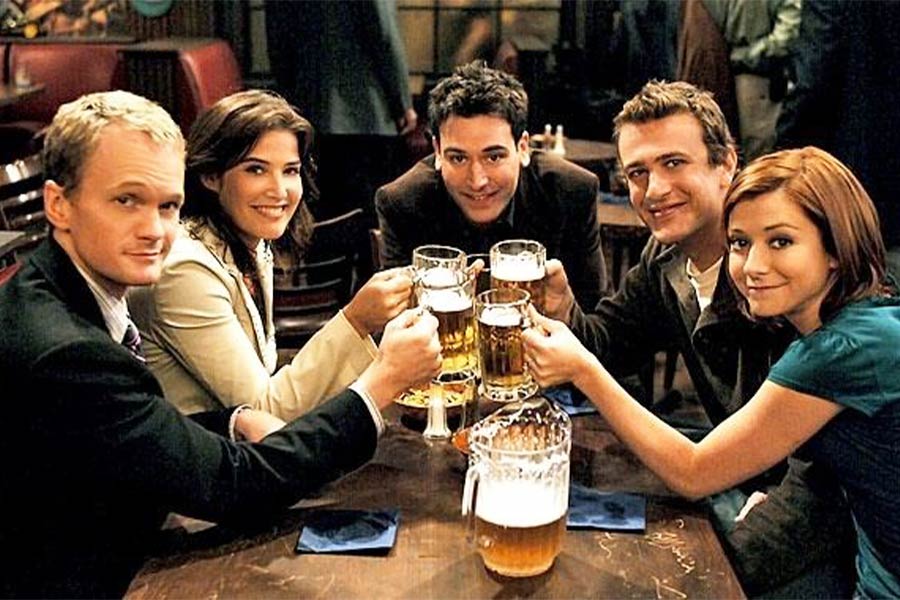
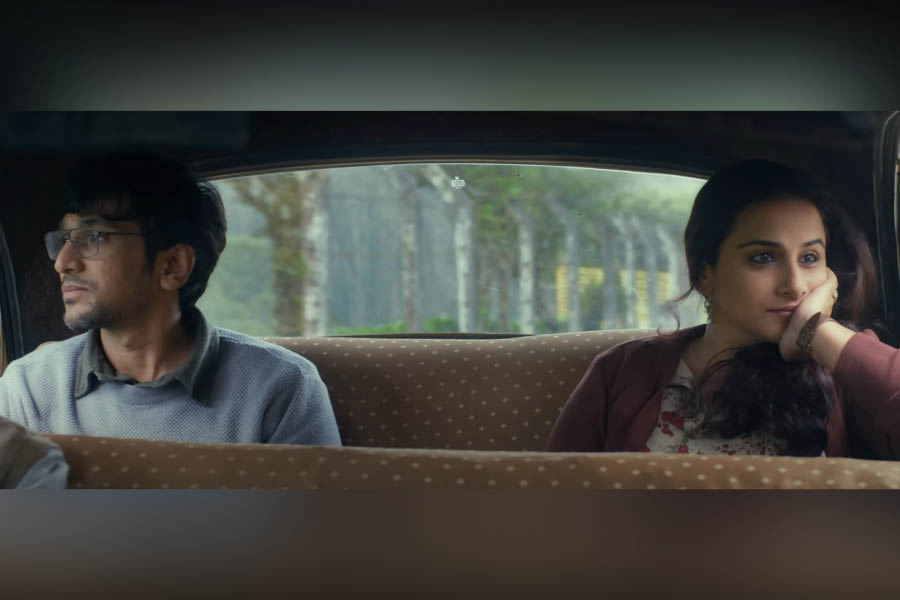
Pratik Gandhi too gives a terrific turn in the Shirsha Guha Thakurta-directed film co-starring Sendhil Ramamurthy and Illeana D’Cruz