


A vacation can’t get in the way of Milind Soman’s fitness regime
This unique filter makes you look like Sheldon Cooper!
Enjoy the ‘zaika’ of north India with celebrity chef Sweety Singh
Make Lemon Chilli cocktail — the perfect way to keep cool this summer
Catch bassist Mohini Dey playing for Willow Smith’s Tiny Desk Concert
For JNU to regain its position, the unique features that made it a great institution need to be brought back in the form of inclusive admission, academic practices, and participatory governance
SUKHADEO THORAT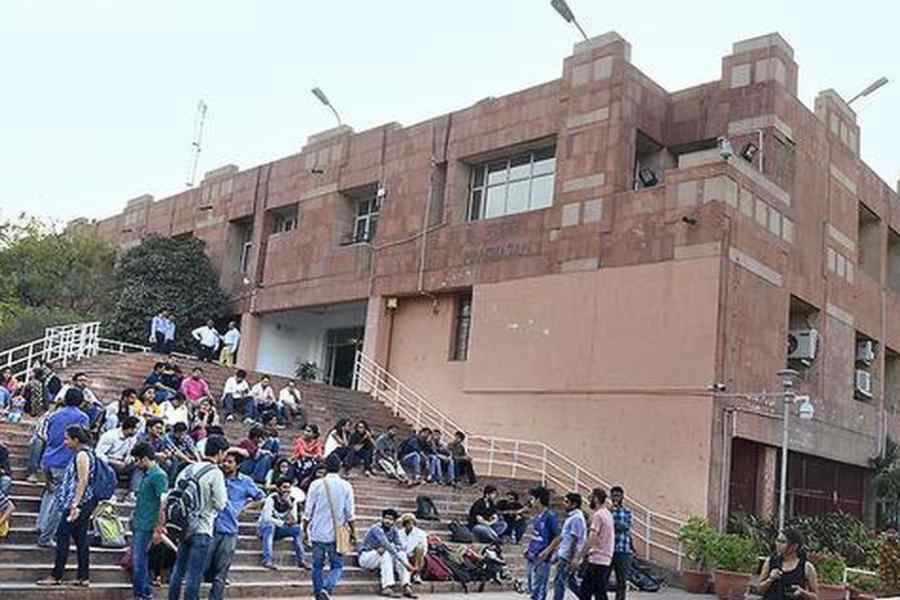

CHINA DIARY | A furious counsellor probably decided to teach the fresher a lesson she’d never forget, or at least that’s how Chun’s mother sees it. The college, expectedly, refutes this
NEHA SAHAY
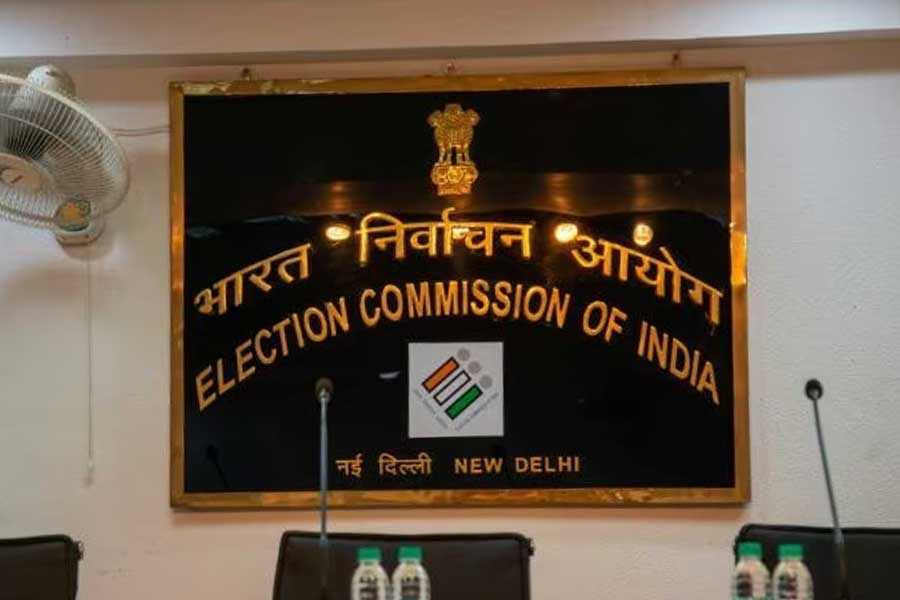
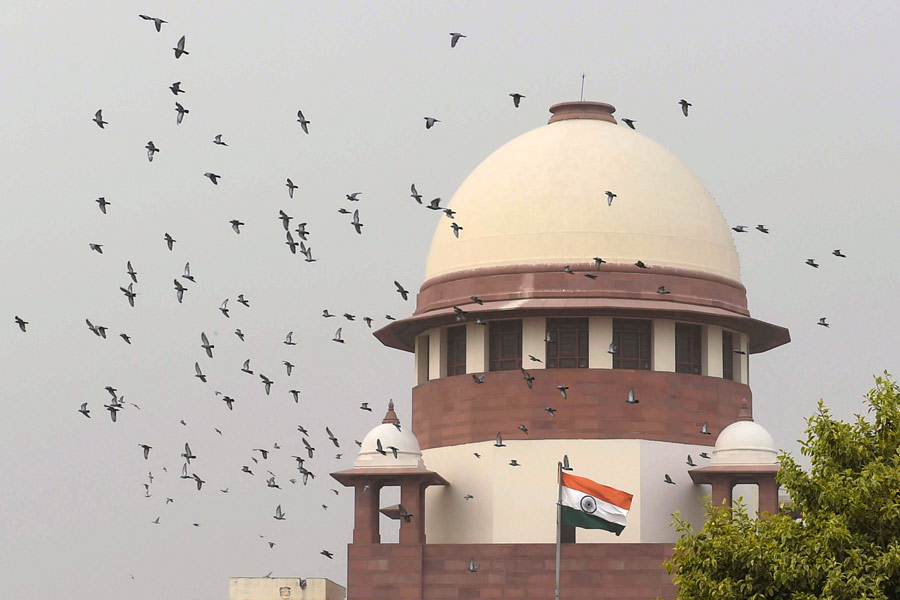
The issue of electoral bonds in India — they have been declared illegal by the Supreme Court — has some parallels with the Super Political Action Committees in the United States
LUV PURI
This is why reading translations of works written in languages other than those one is conversant in is important: it exposes you to ideas you might not have encountered otherwise
RISHI MAJUMDER
Option for Nota was granted in 2013, but its effect has remained symbolic since then. Nota votes register people’s dissatisfaction with all candidates, yet nothing is done about it
THE EDITORIAL BOARD


The Fall Guy is directed by David Leitch, a former stuntman who has helmed films like Atomic Blonde and Bullet Train