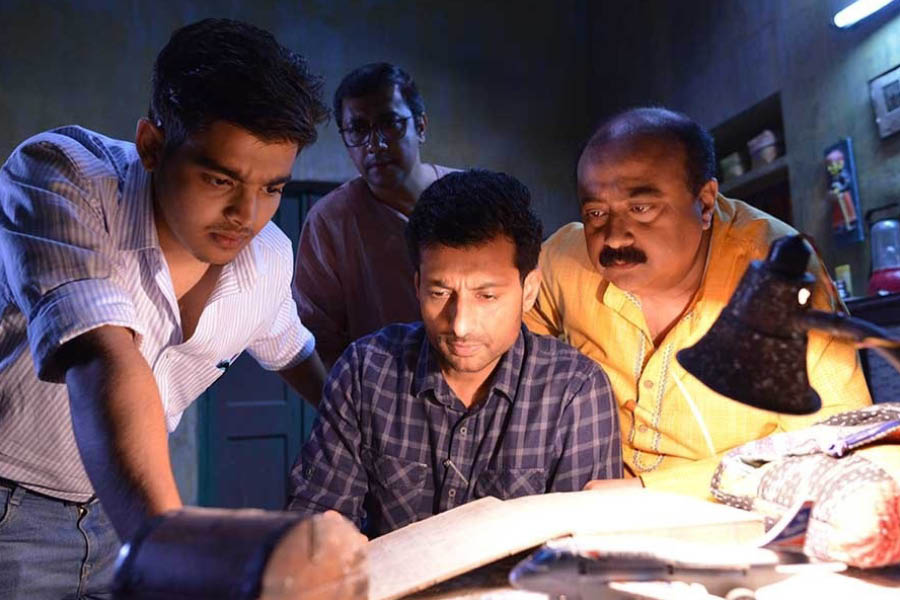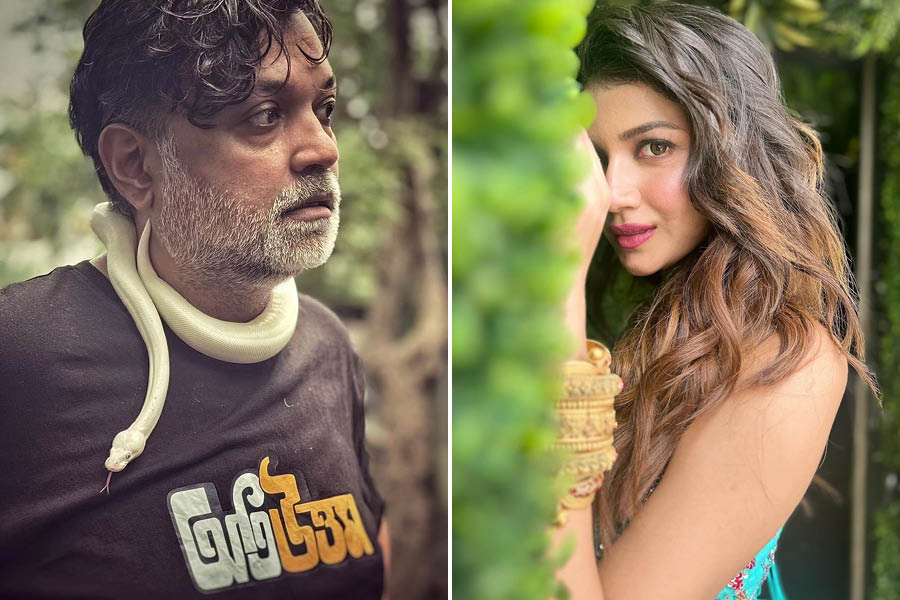


Celebrate Mother’s Day with Sandip Ray’s latest Feluda film, ‘Nayan Rahasya’
Surprise your mom with a long drive to Kolaghat with a scenic stop at Deulti
Gift the unconditional nurturer a very special book on Mother’s Day
Treat your mom to some awesome food at Boo-Tang on Camac Street
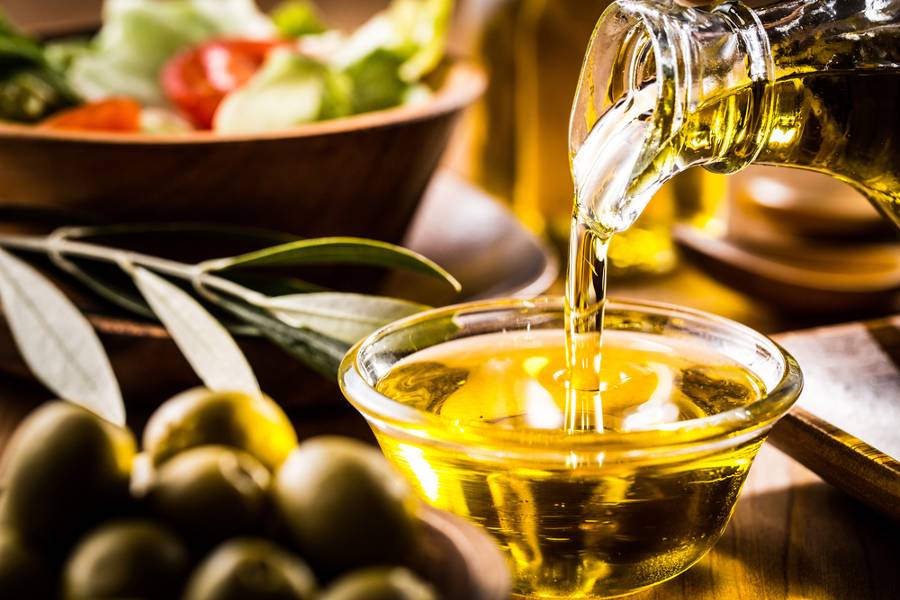
Pamper your mom by making a sumptuous breakfast at home
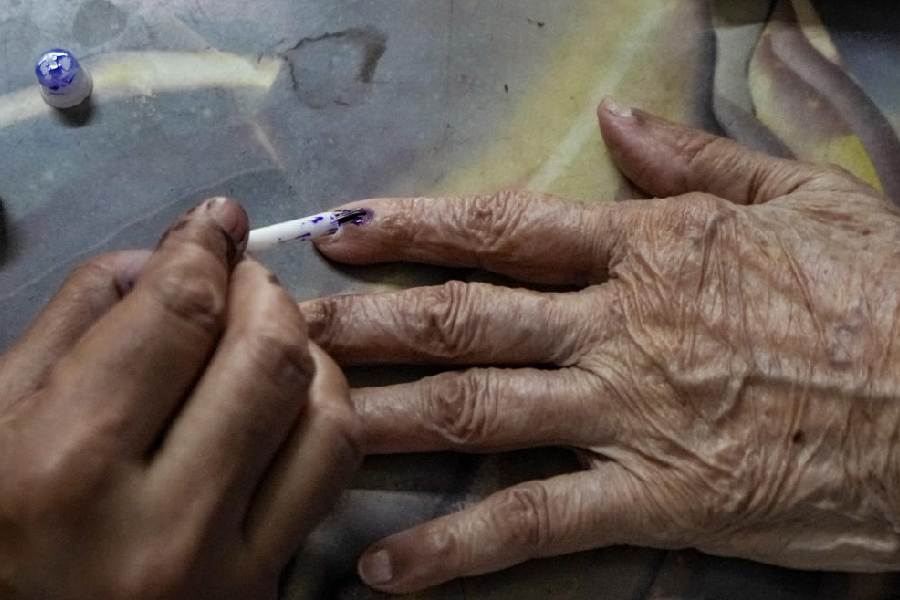
My voting life began in a republic deformed by the Emergency and Mrs Gandhi’s experiments in communalism. Her party’s complicity in the pogrom of Sikhs created precedents that changed the republic forever
MUKUL KESAVAN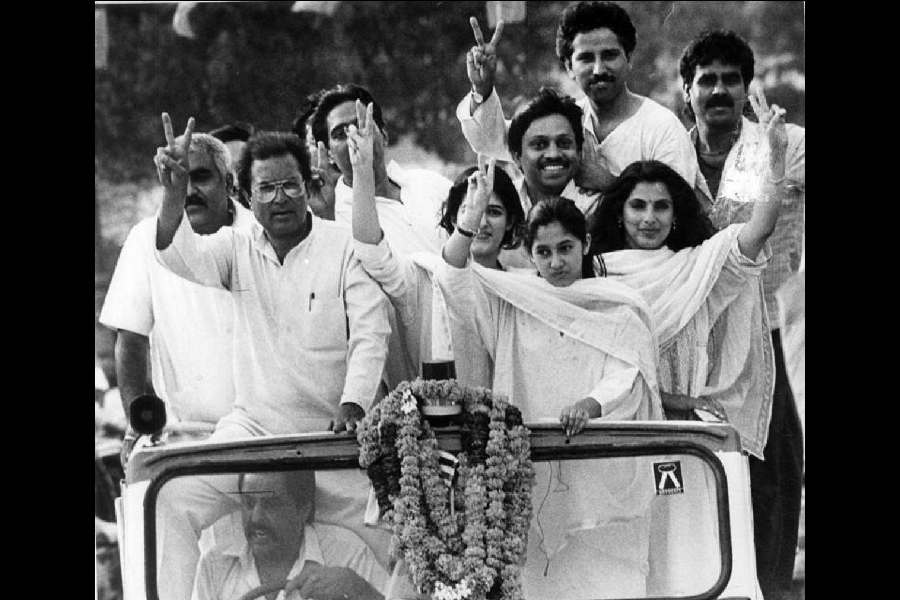

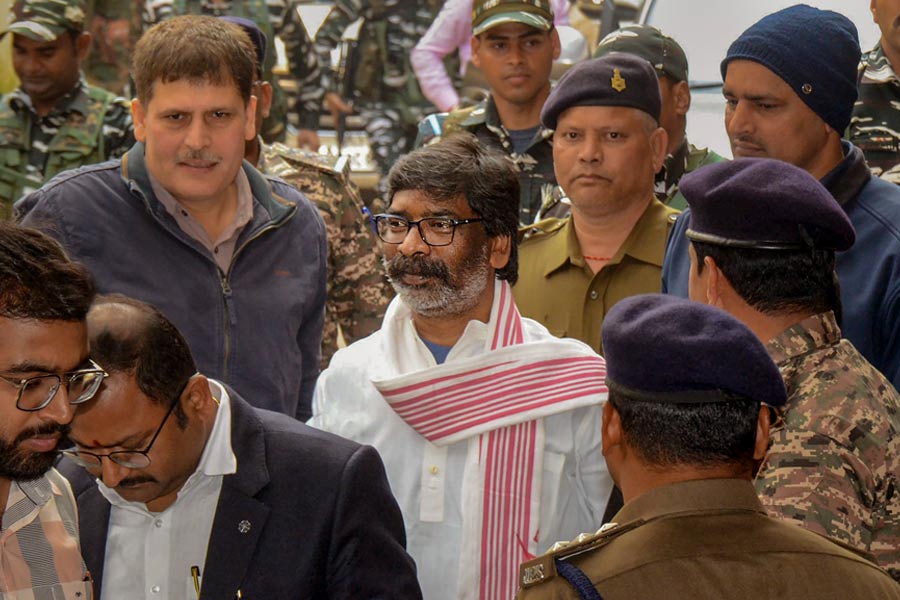
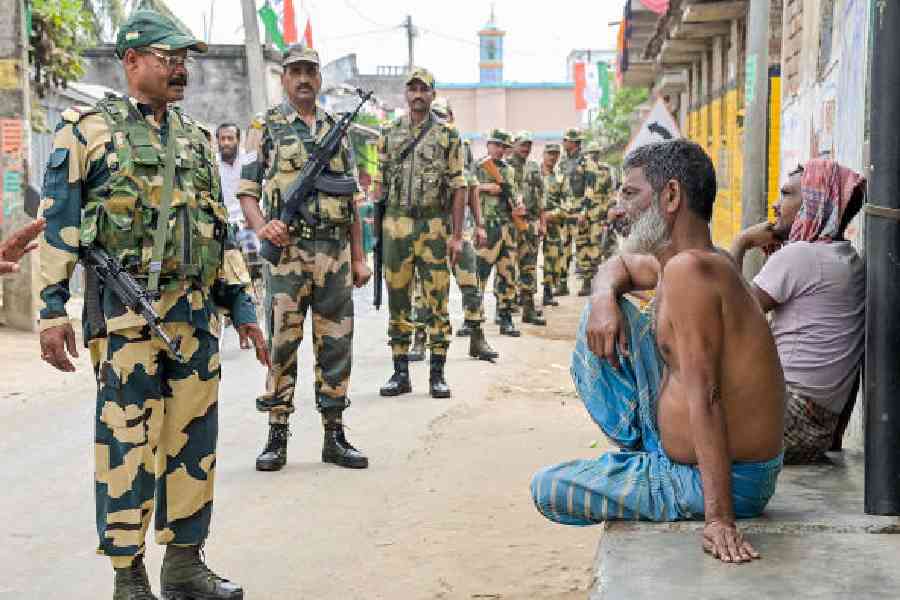
Things are often aggravated in the hills. The seven-phase Lok Sabha election heightens the drama with ominous warnings that Sikkim might one day acquire a Bihari or Marwari chief minister
SUNANDA K. DATTA-RAY
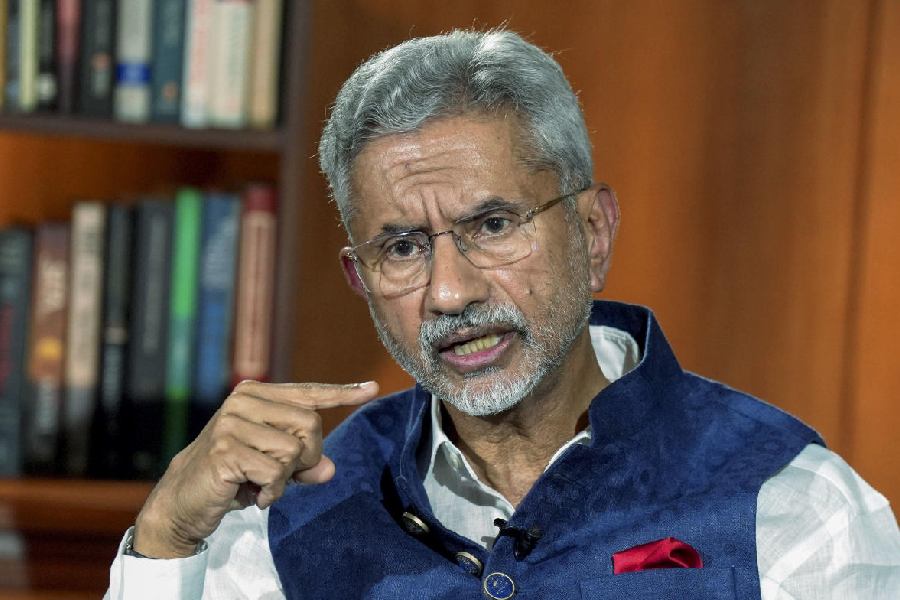
When the Babri Masjid was demolished, the response in Kerala was driven by secular values. But now I find that some people are openly supporting such indefensible acts
R. RAJAGOPAL
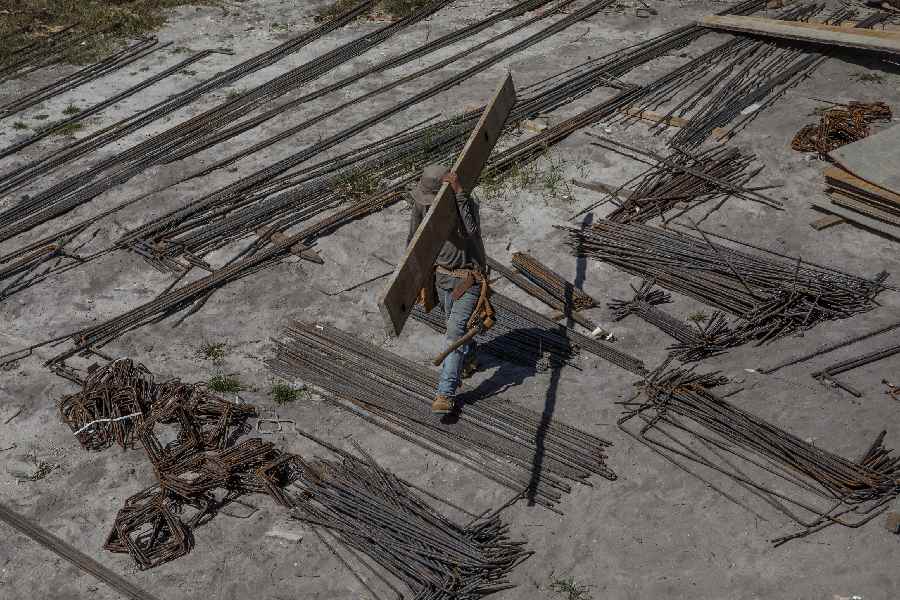
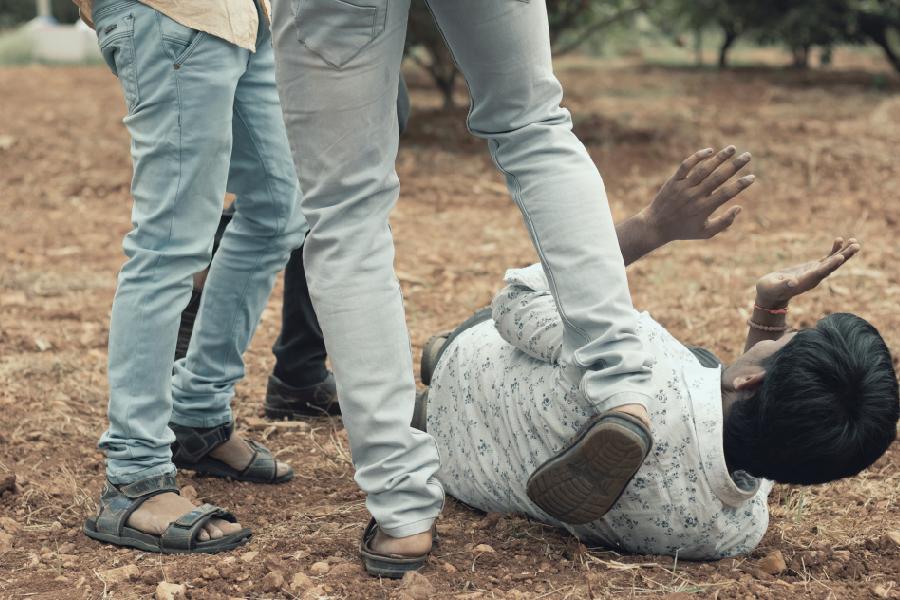
FRA seems to be a crucial issue in many constituencies — most acutely in states like Jharkhand, Madhya Pradesh and Odisha — that are going to the polls in the remaining phases of the elections
JAIDEEP HARDIKAR
Illness is not a condition for art, but affliction seems to push artists to a kind of superhuman efflorescence of creativity to defeat it. Art may be beautiful or terrible, but it is always pitiless
THE EDITORIAL BOARD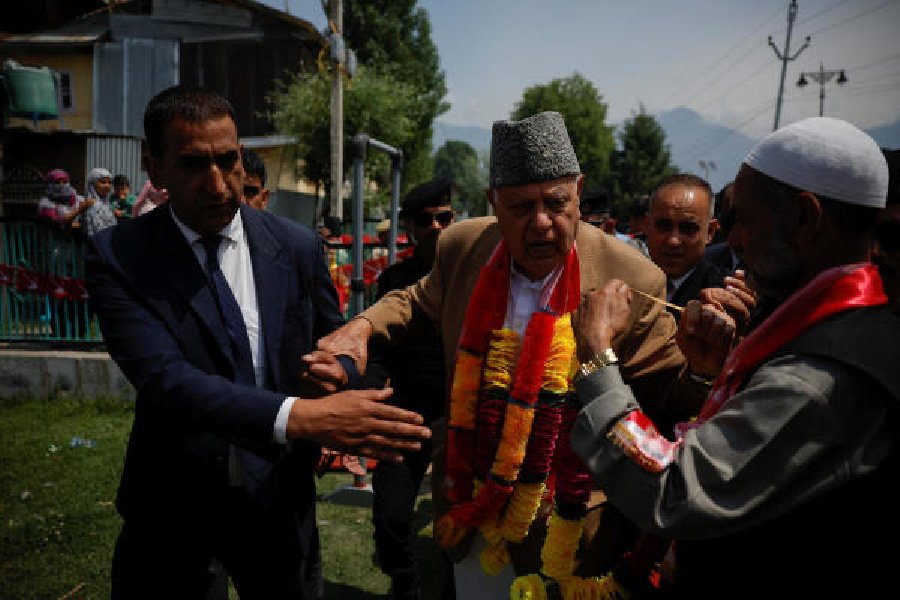


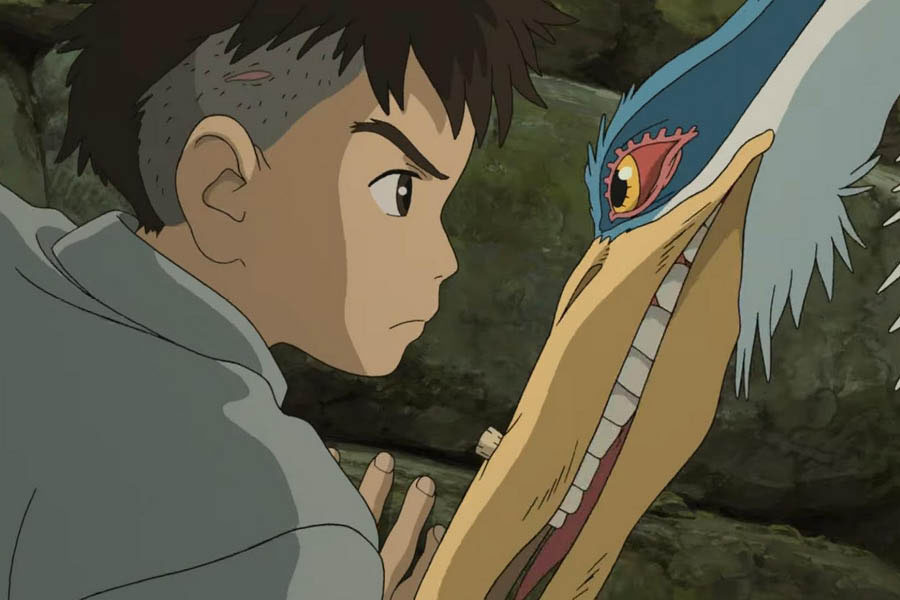
Touted as the veteran Japanese filmmaker’s final Studio Ghibli project, The Boy and the Heron bagged the Best Animated Feature award at the 96th Oscars