


Big B and Rajnikanth have joined hands for ‘Vettaiyan’ after 1991 hit ‘Hum’
Gear up for Baahubali’s animated spin-off
Get trendy with this Ayushmann Khurrana-approved lifestyle brand
Don’t miss Nussrat Jahan’s hilarious attempt at using chopsticks
Beat the heat with chef Kunal Kapur’s Rose Mojito recipe
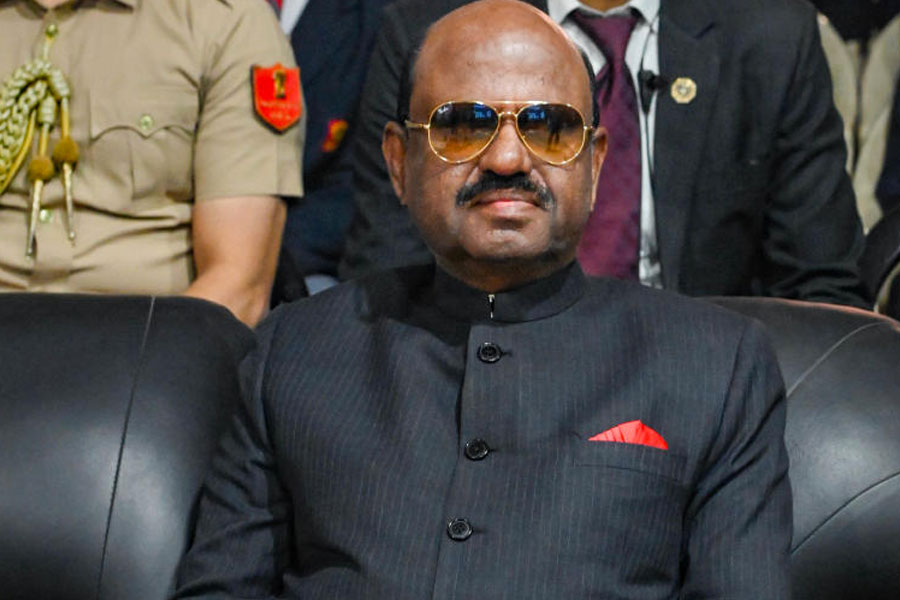
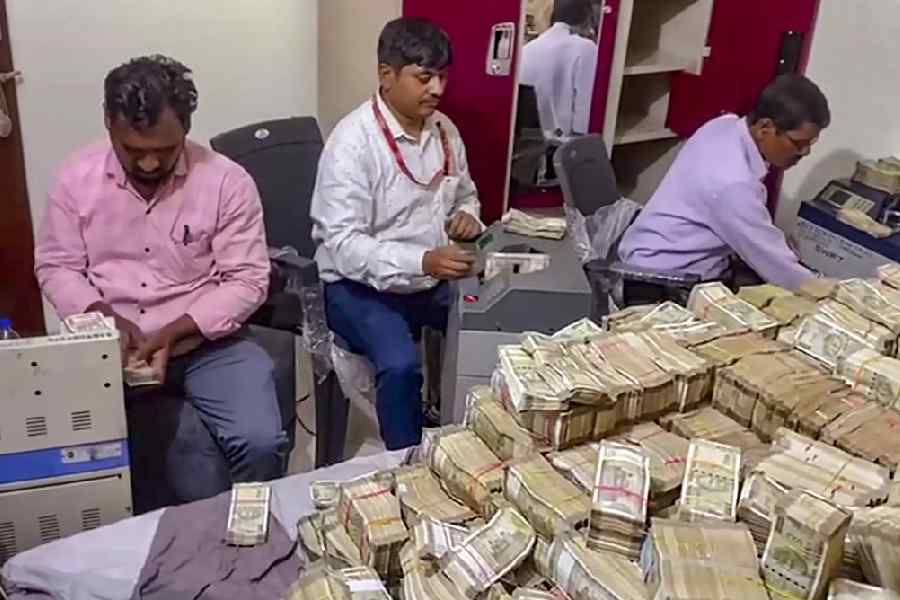
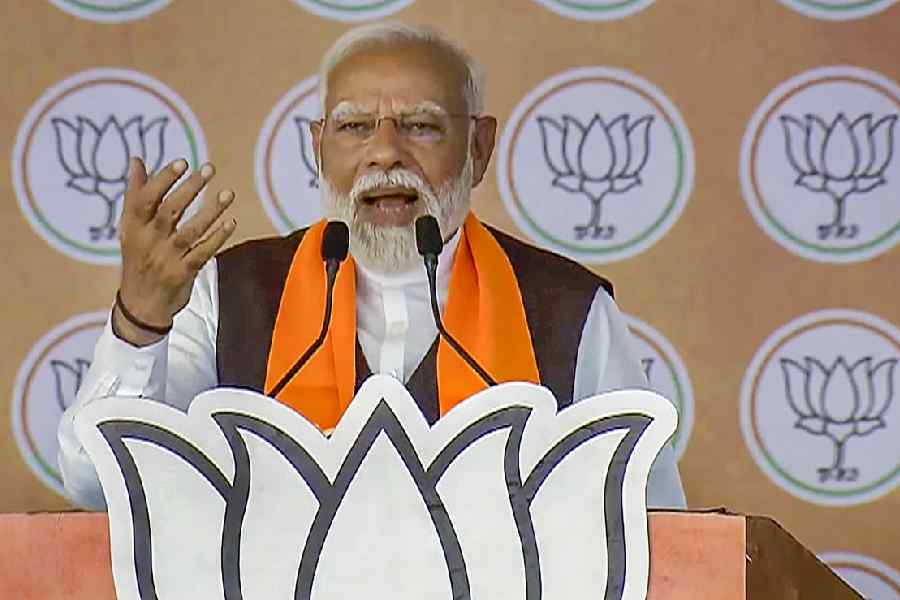
Let us reflect on some hard realities of contemporary India. ‘Mere’ corruption is no longer an electoral issue: we do not shun politicians because they might have their hands in the till or in our pockets
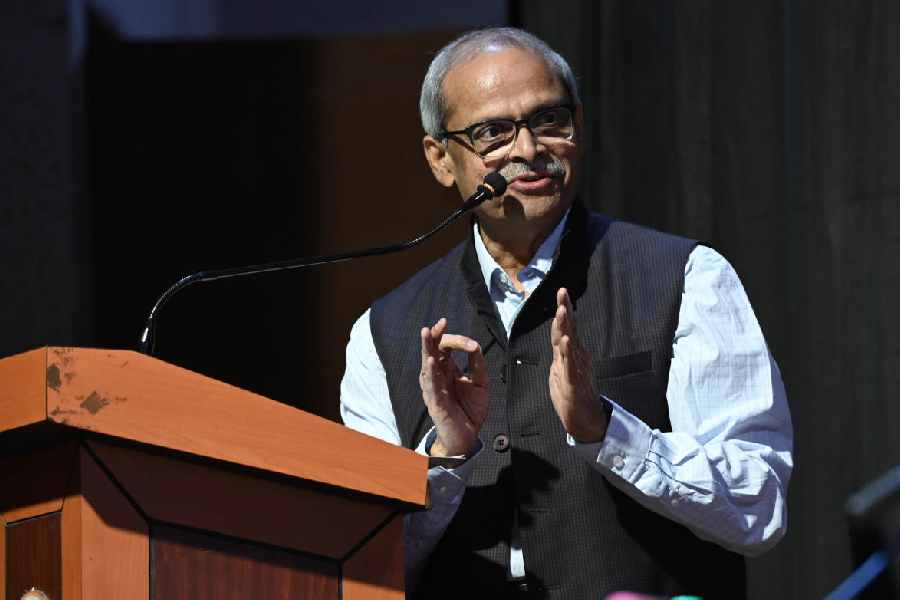
SUKANTA CHAUDHURI
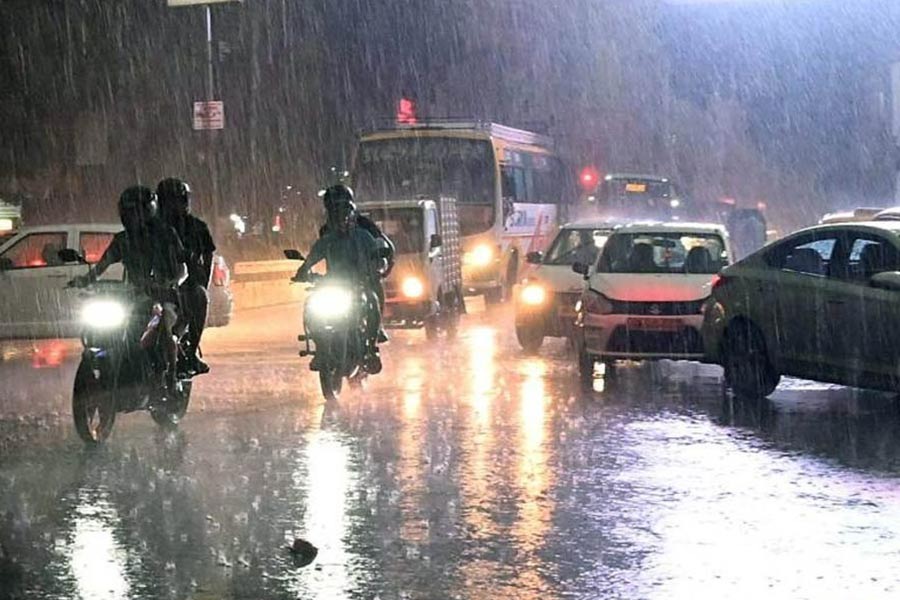
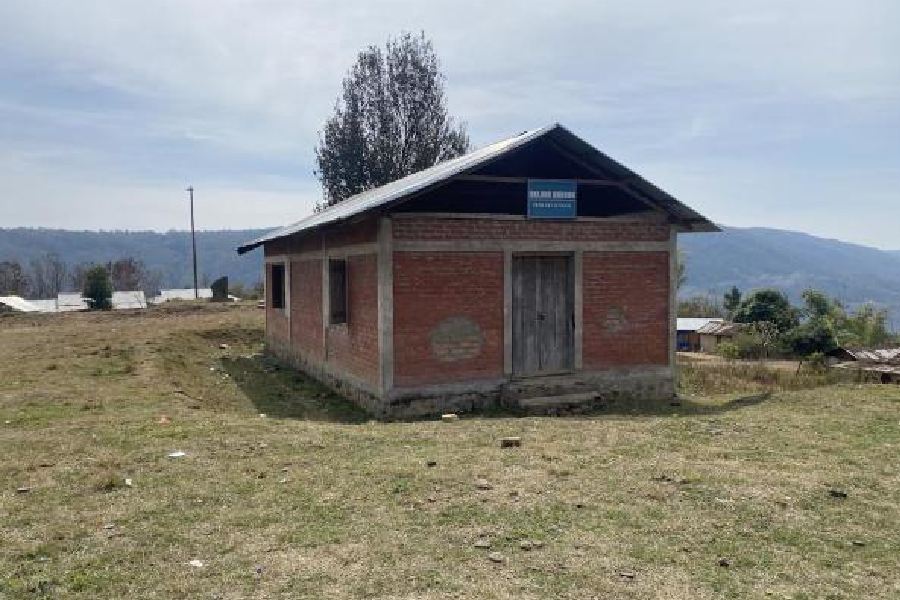
Epidemic Plan, envisioned as a collaborative endeavour among the Central govt, state governments, and relevant stakeholders, aims to provide a comprehensive blueprint for coordinated action
BASIL GUPTA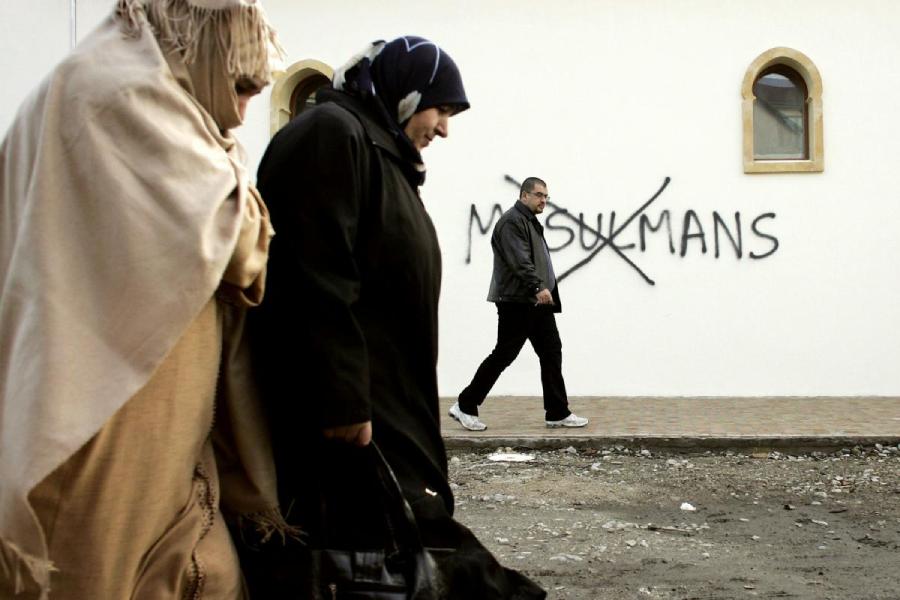
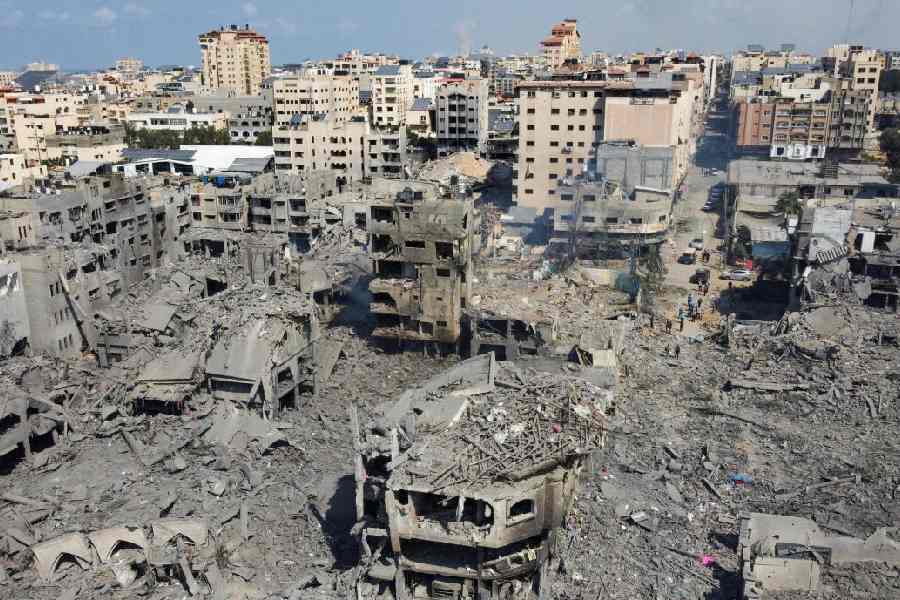
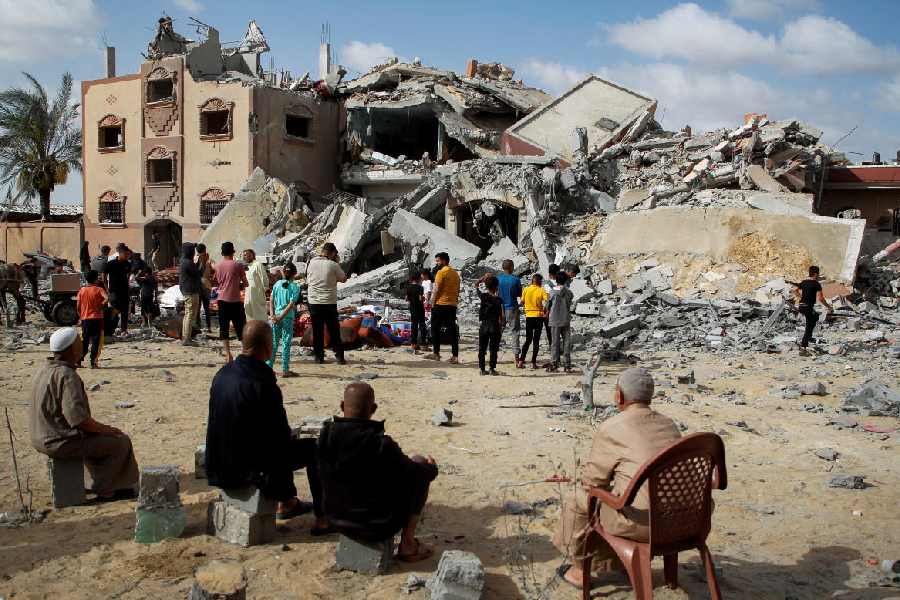
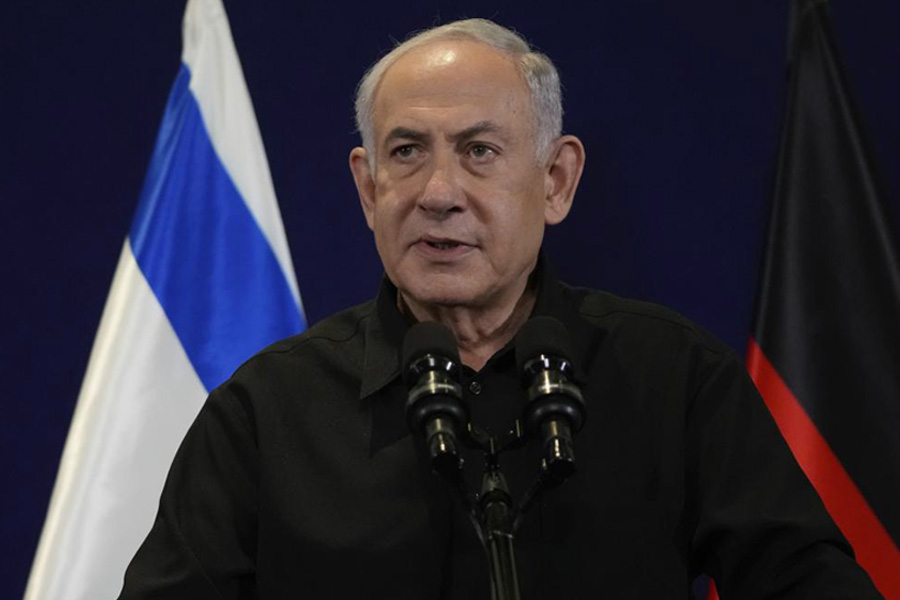
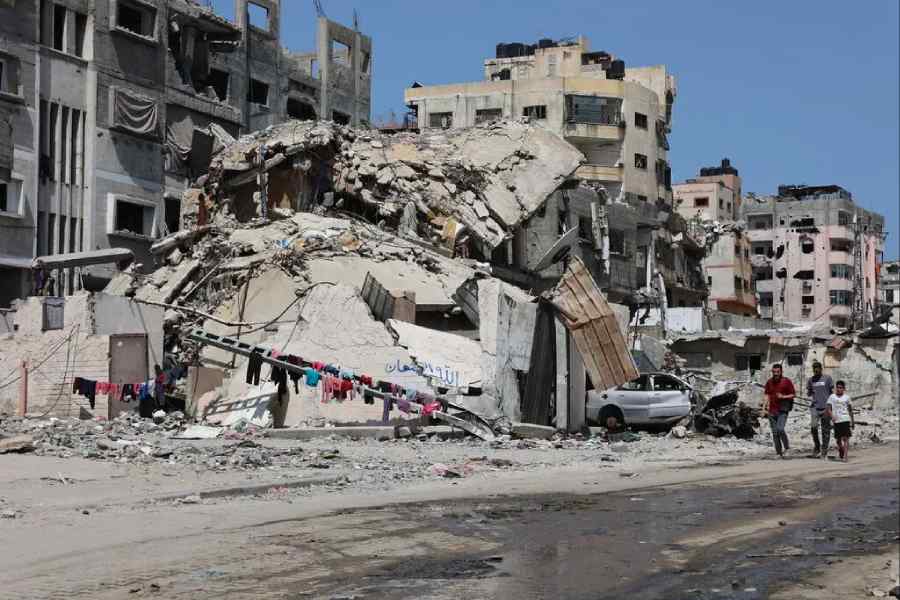
The attitude of the West to its Muslim citizens is beginning to mirror their hostility towards non-client Muslim states abroad. Some of this is a hangover of the ‘war on terror’ since 9/11
MUKUL KESAVAN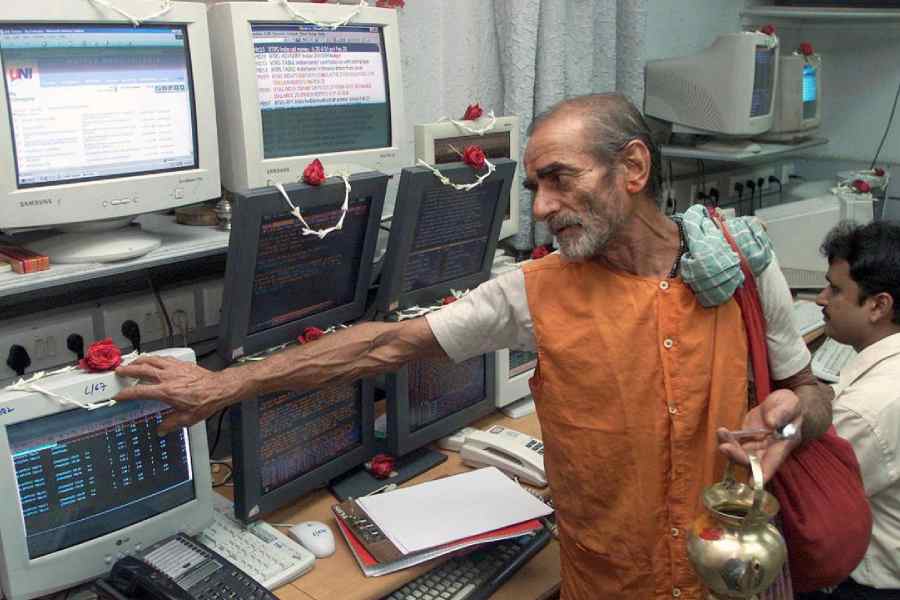
The ideological penetration of Indian science by Hindutva was starkly illustrated by a series of nine linked tweets issued by the secretary of the department of science and technology last month
RAMACHANDRA GUHA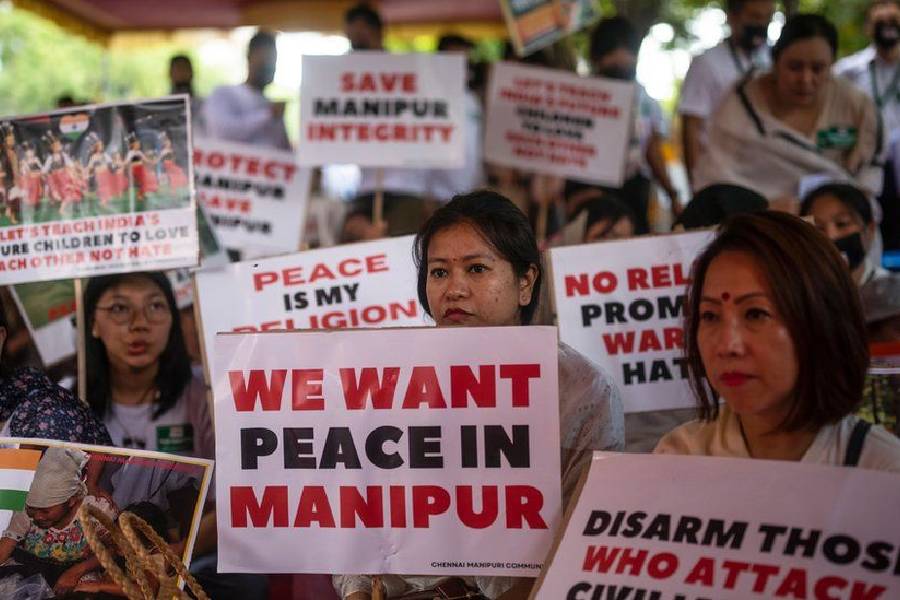
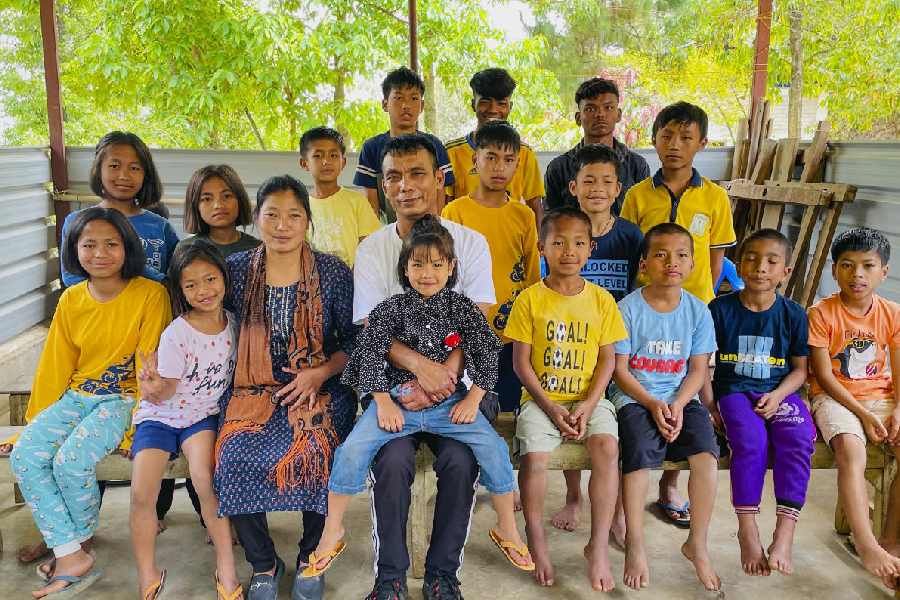
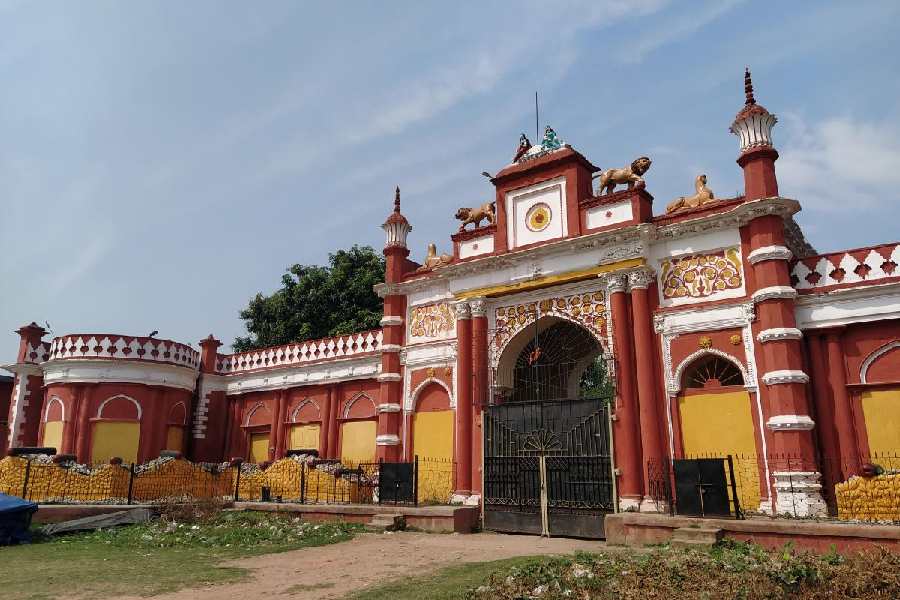
Tapping into the state’s economic potential must also be a representative process. Unity, rather than uniformity, should be the preferred goal while restoring normalcy to Manipur
THE EDITORIAL BOARD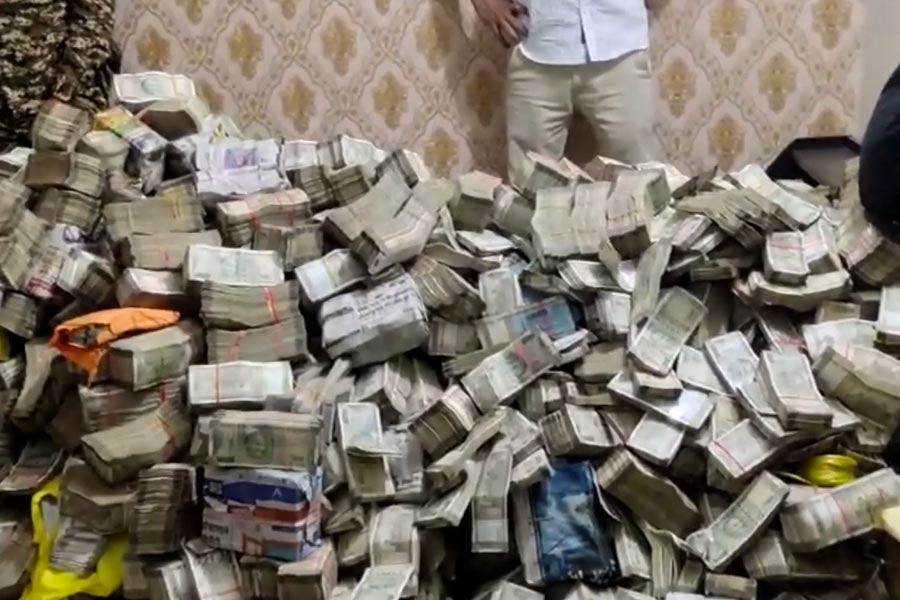


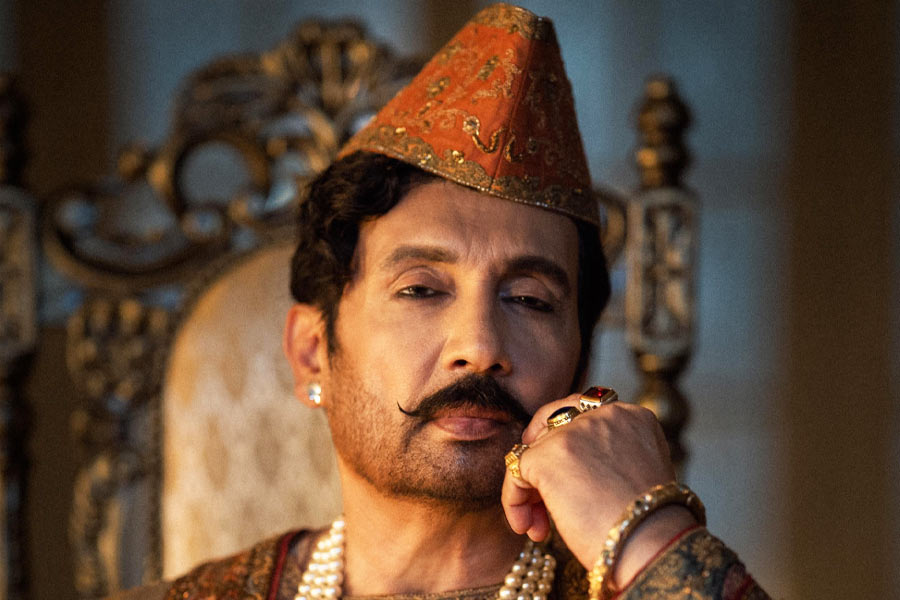
Starring Monisha Koirala, Sonakshi Sinha, Aditi Rao Hydari and Richa Chadha, the eight-episode Heeramandi is streaming on Netflix