


Cricketer Pat Cummins met ‘Spyder’ star Mahesh Babu in Hyderabad
We can’t stop gushing over Suhana Khan’s Italian vacay!
Have you tried Baskin Robbins’s new summer edition?
Healthy living made simpler with Guduchi Ayurveda’s health juices
Anastasia Beverly Hills’ Lip Velvet Collection arrives at Boddess!
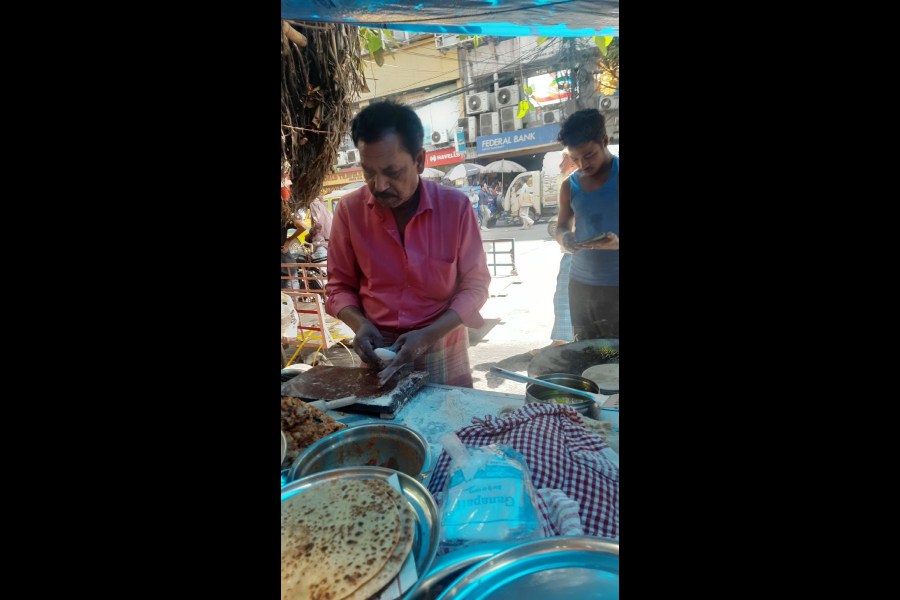
Some argue that the cops wearing Hindu attire is nothing more than a gimmick initiated by senior police officers who want to please their current political masters during the election season
SUSHANT SINGH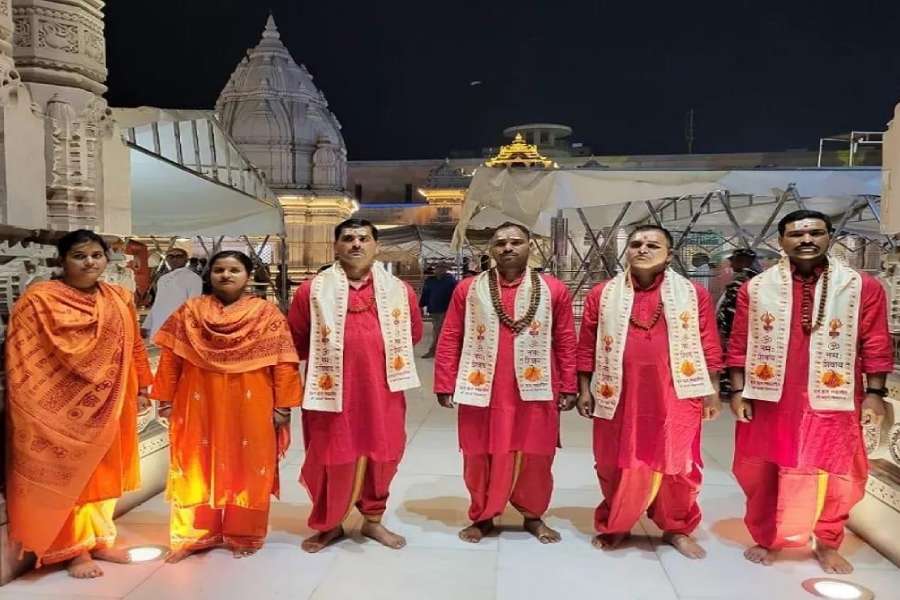

The demand for energy and other resources will be far greater than what it is now, not only because of the higher numbers but also because of greater consumption by those moving out of poverty
ANAMITRA ANURAG DANDA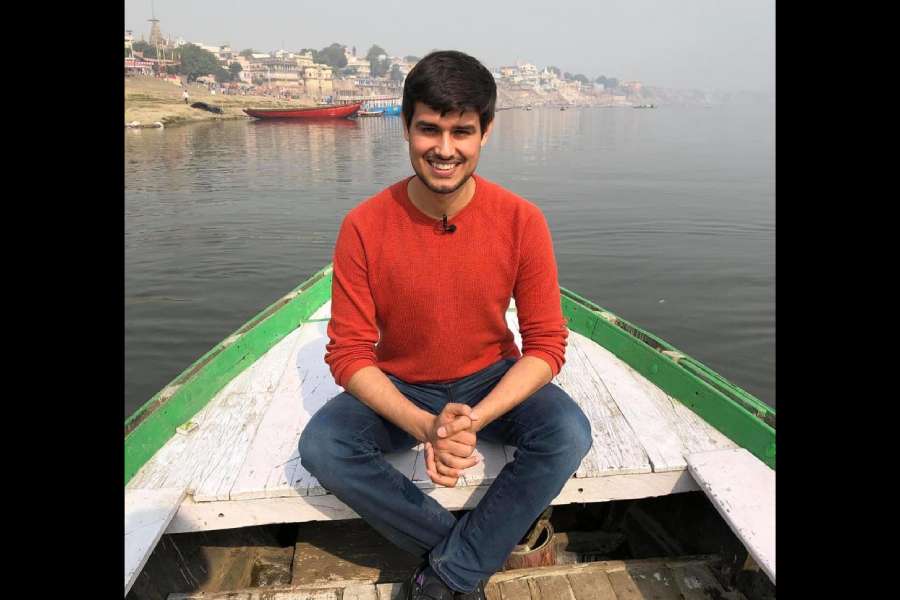
Whether it is in the video on the Adani Group or in the video about unemployment, Rathee likes to examine the biggest companies from the lens of jobs they are creating
SEVANTI NINAN
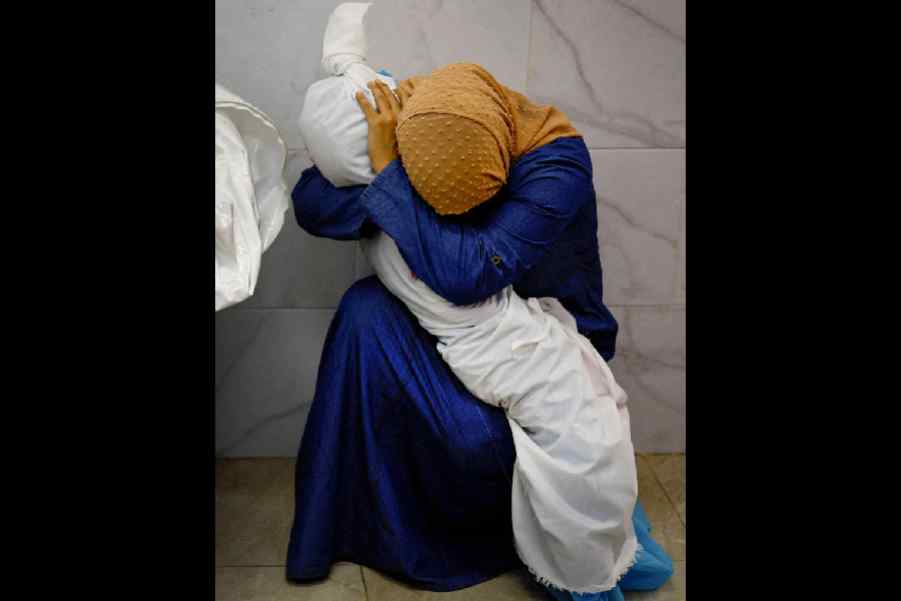
Improvement in standards of living among the affluent can prevent communicable diseases. But vaccines play a key role among disadvantaged constituencies to help them tide over medical crises
AMITAV BANERJEE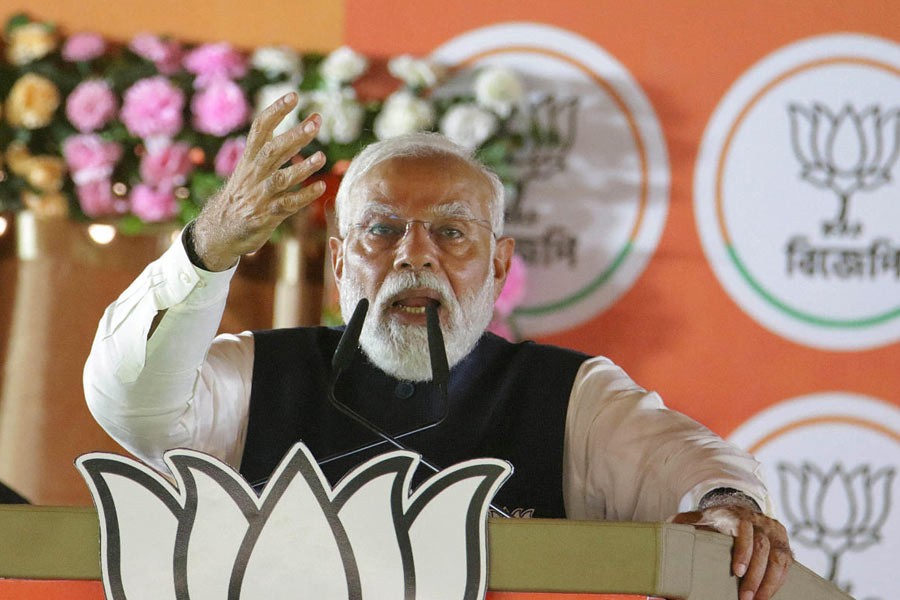
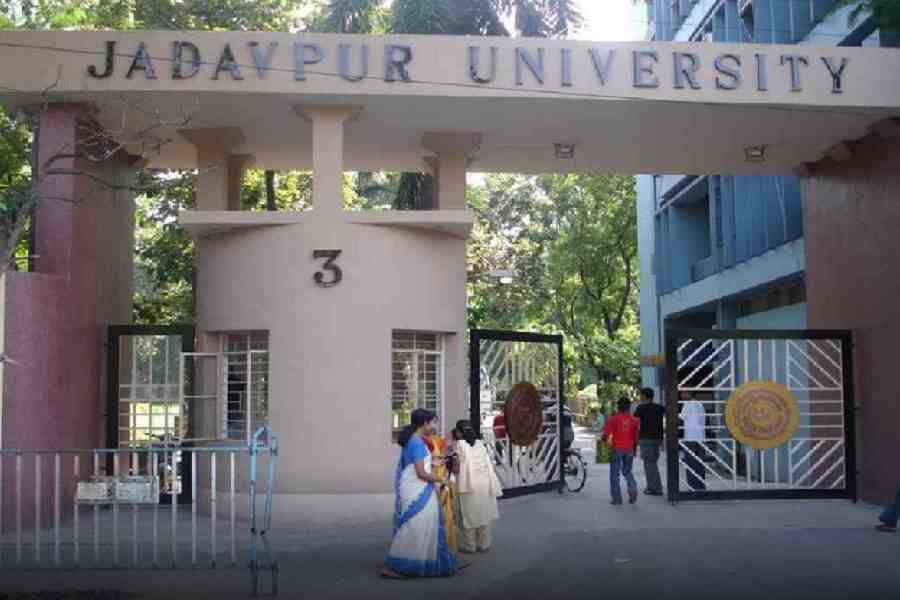
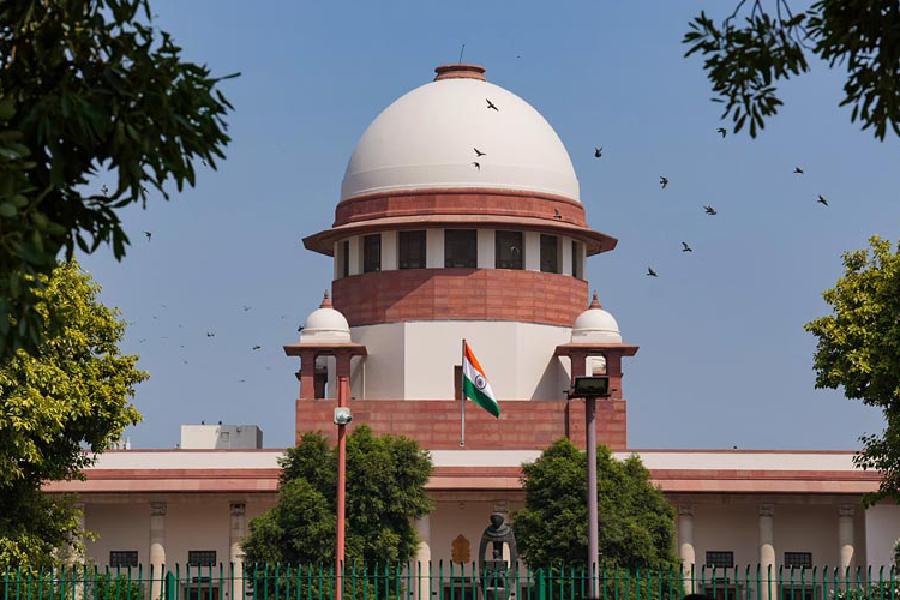
It appears that the Bharatiya Janata Party's numerical majority, achieved through means fair and foul, could also render some of the basic constitutional tenets vulnerable in the public eye
THE EDITORIAL BOARD


TVF’s Yeh Meri Family Season 3 co-starring Rajesh Kumar and Hetal Gada is streaming on Amazon MiniTV