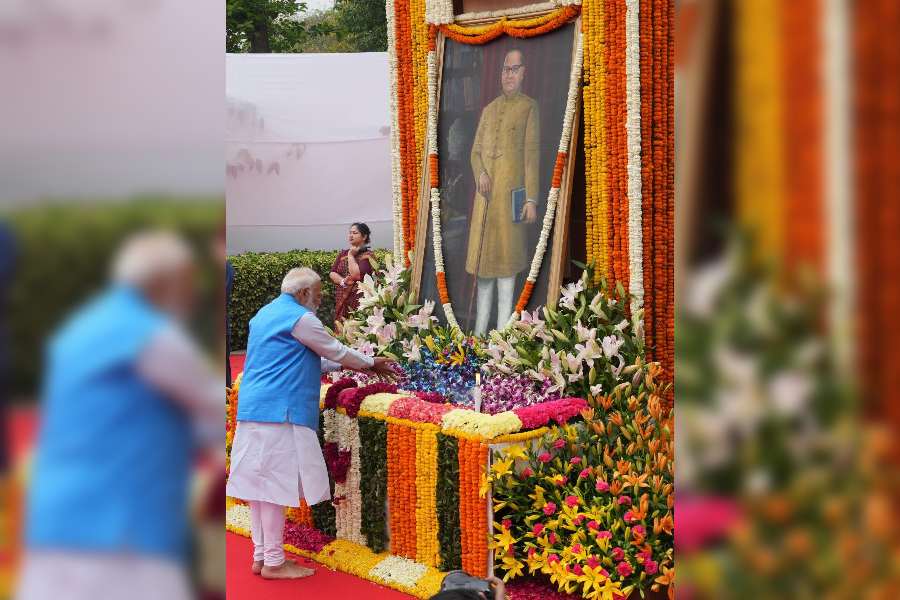


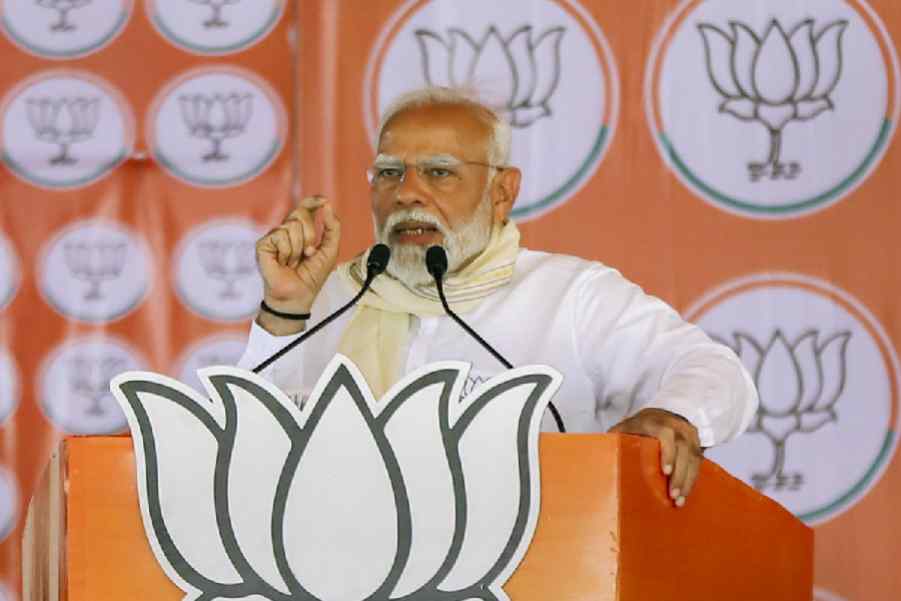
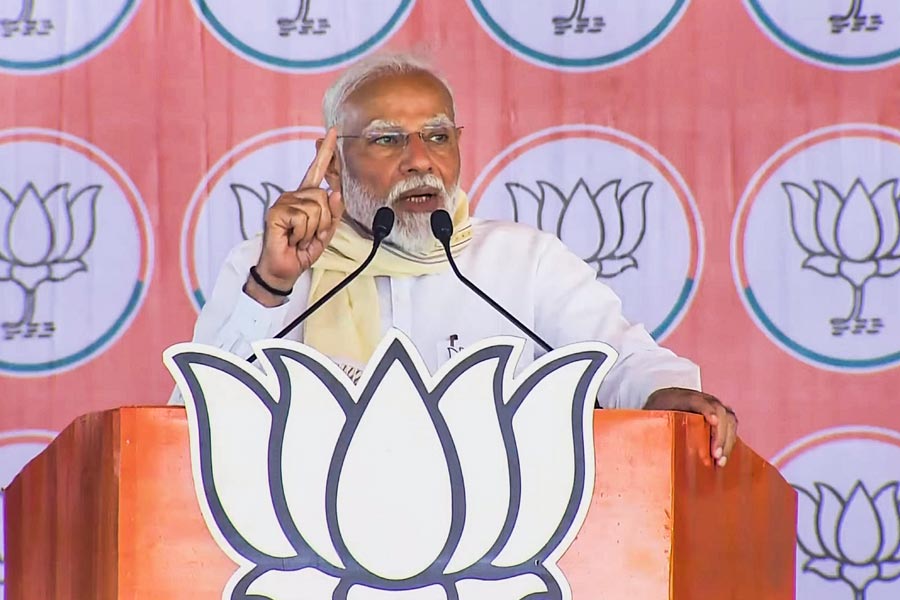
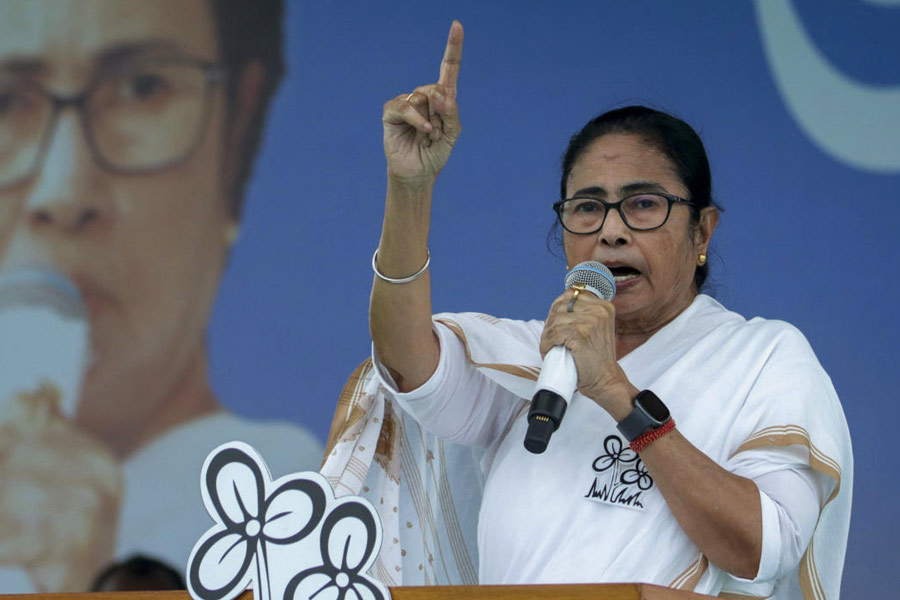
Back in the 1970s, Indira Gandhi combined authoritarianism with a devotion to family rule; now, Narendra Modi combines authoritarianism with a devotion to Hindu majoritarianism
RAMACHANDRA GUHA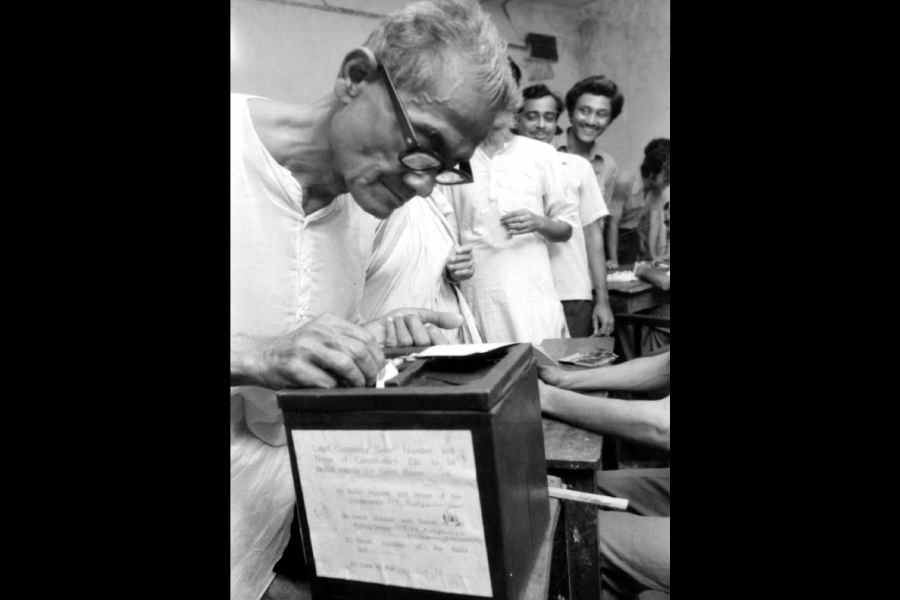
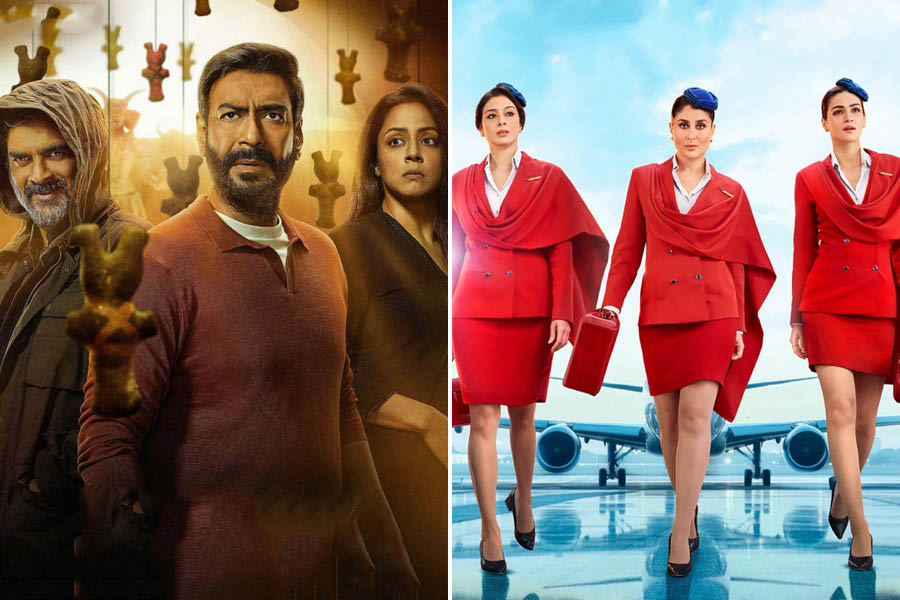
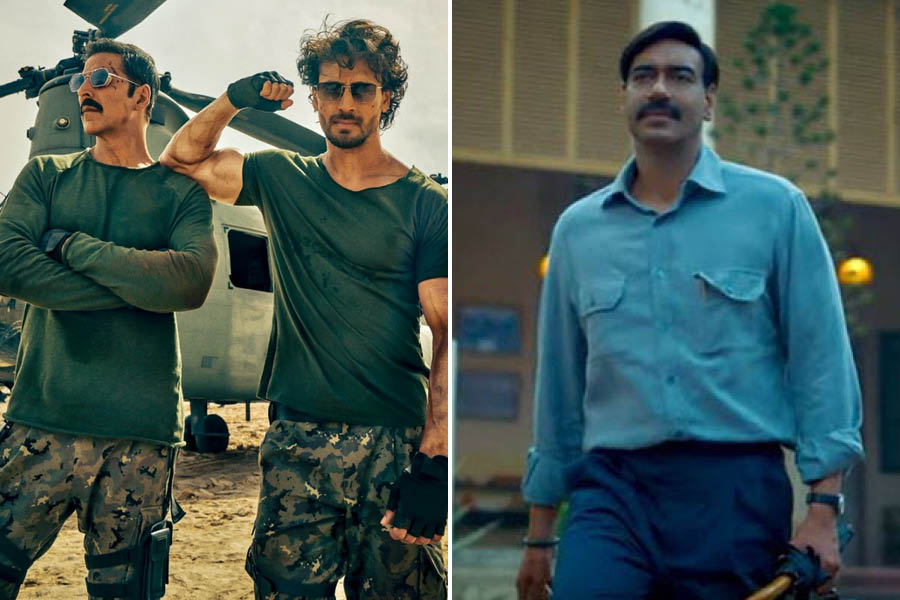
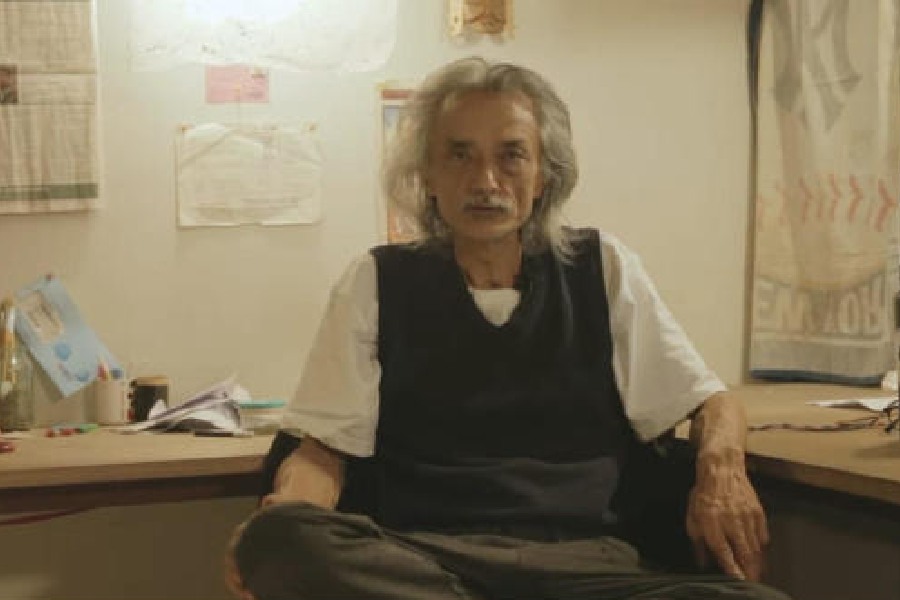
Cultural memory & nostalgia, Indian cinema, literature, and art serve not only as repositories of the nation’s memory but also as vibrant arenas where the past is both contested & revered
SANJAY KAUSHAL
Notwithstanding a repeated history of strikes and counterstrikes as part of the shadow war between Israel and Iran, an attack from an aircraft on a diplomatic building is unusual
T.C.A. RAGHAVAN
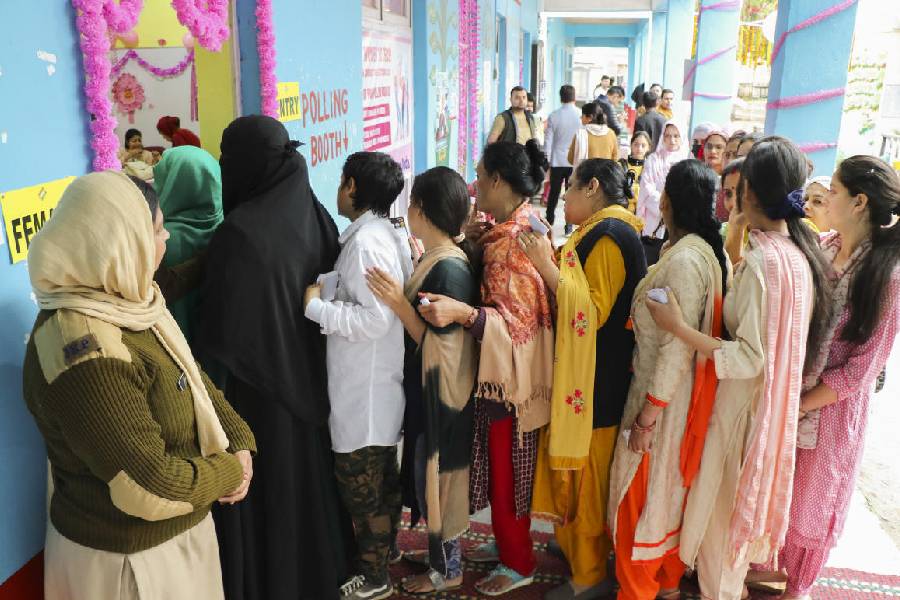
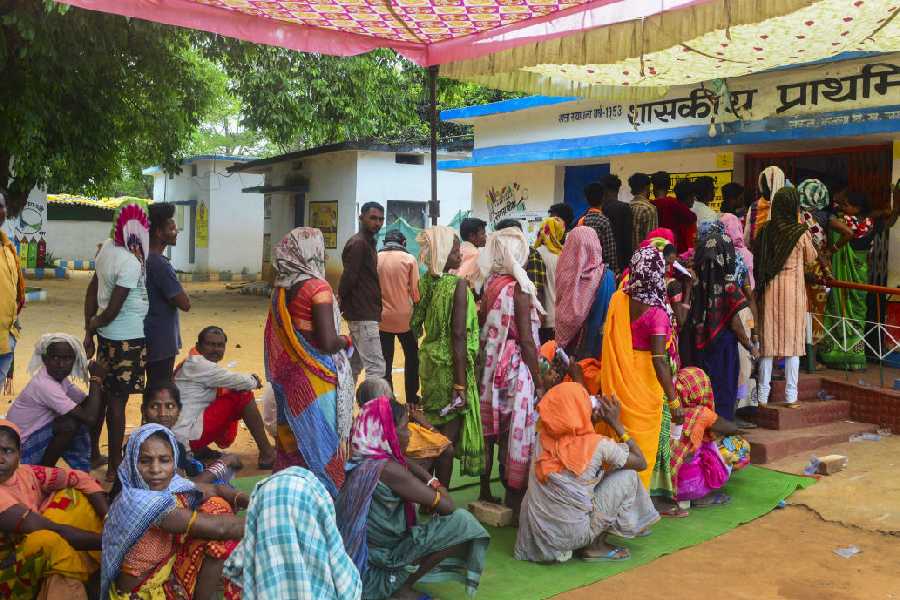
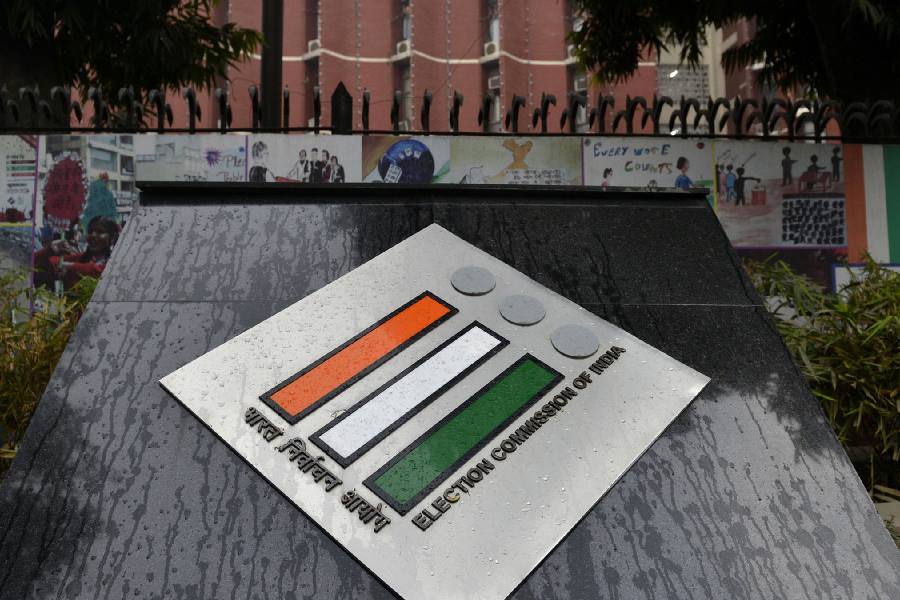
Arunachal Pradesh is replete with unemployment, lack of roads and drinking water, poor literacy (four candidates are illiterate crorepatis) and negligible representation of women
SUDIPTA BHATTACHARJEE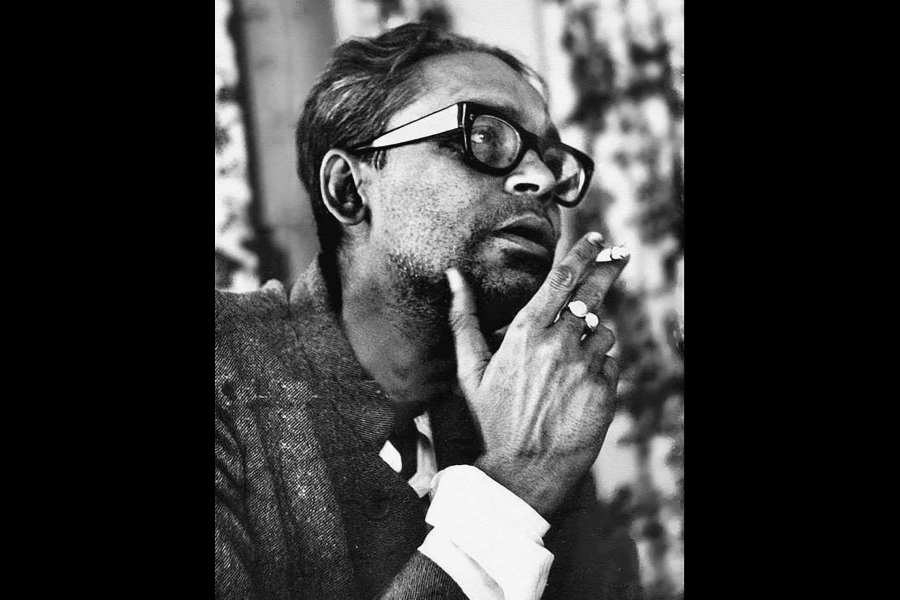
Ritwik Ghatak, for example, who is about to turn 100 in 2025, can become an icon claimed by all, whether or not they have seen his films. While iconisation is a tribute, it is also blinding
THE EDITORIAL BOARD


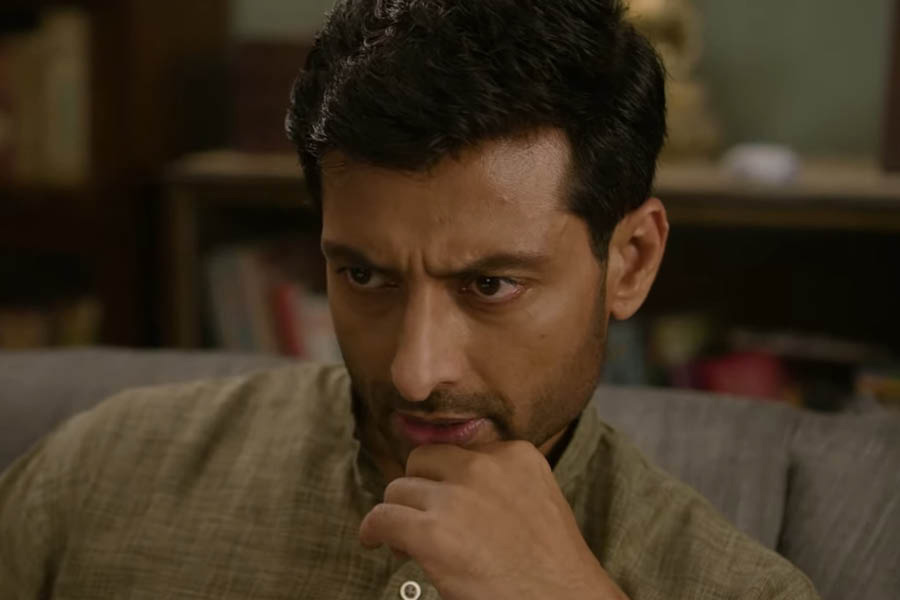
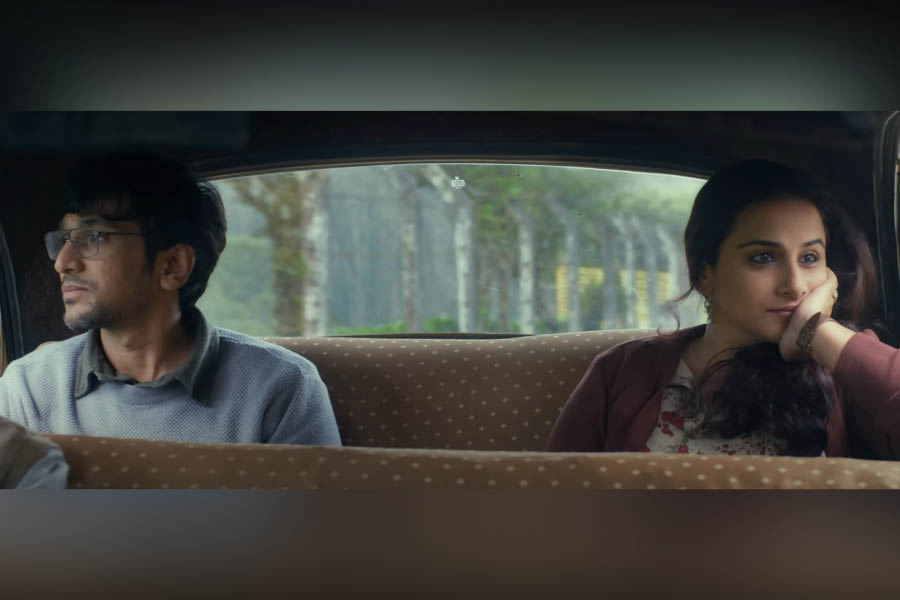
Pratik Gandhi too gives a terrific turn in the Shirsha Guha Thakurta-directed film co-starring Sendhil Ramamurthy and Illeana D’Cruz