


Cricket and love collide as ‘Mr and Mrs Mahi’ trailer drops ahead of its release
Bipasha and Devi’s Mother’s Day plan was a thoughtful one
Devlina Kumar pays a tribute to Yashoda through her dance performance
Veena maestro Bhagyalakshmi Chandrasekhar plays ‘Come September’ theme song
These travel bags are a must-have if you are planning a trip
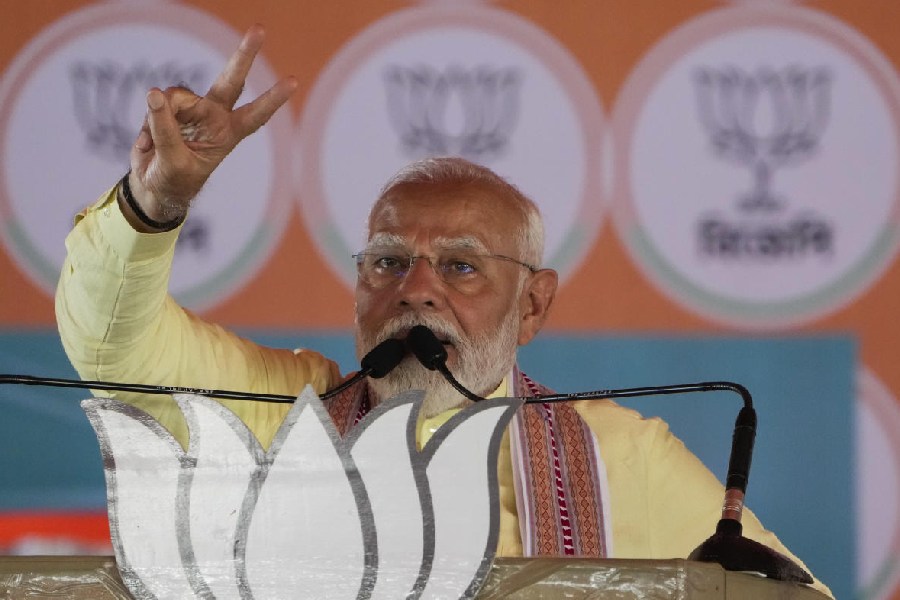
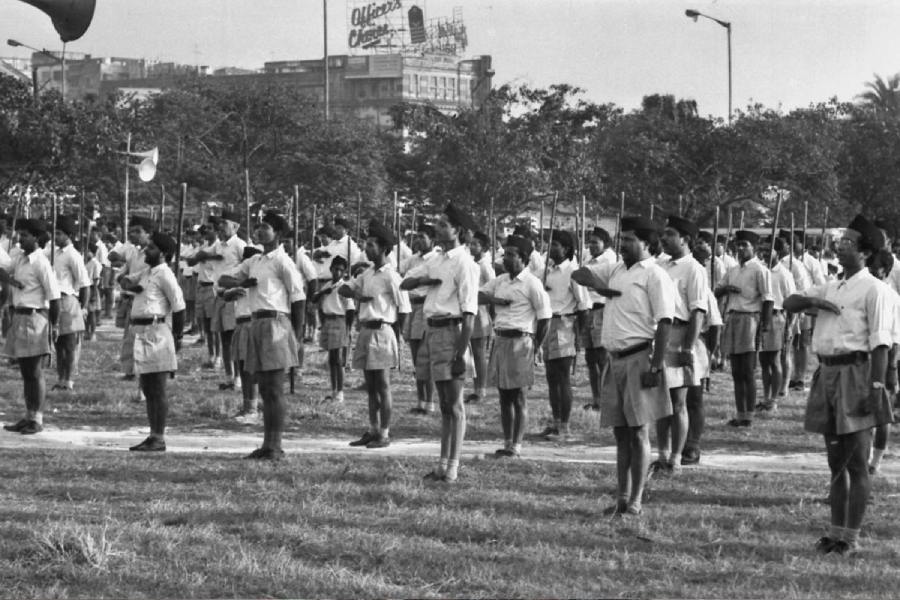
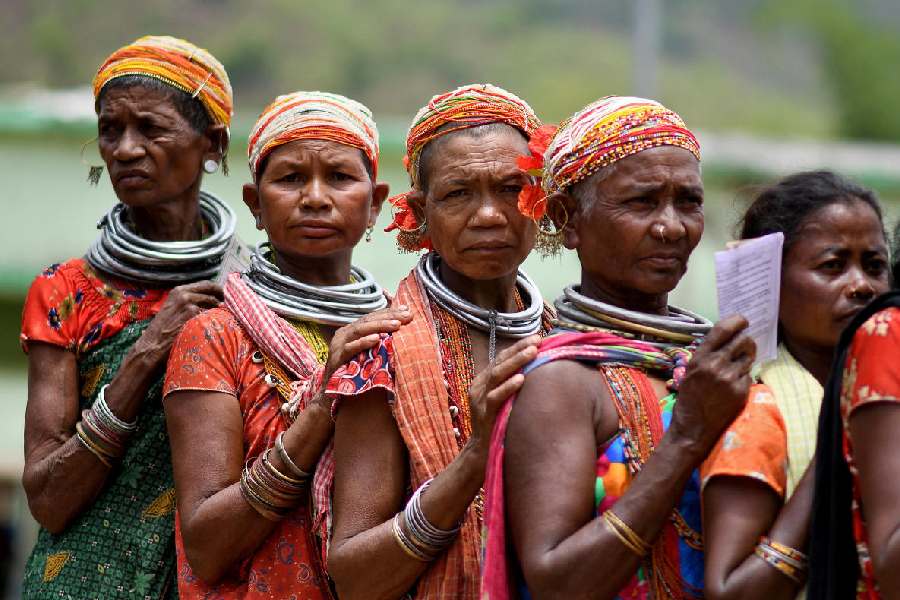
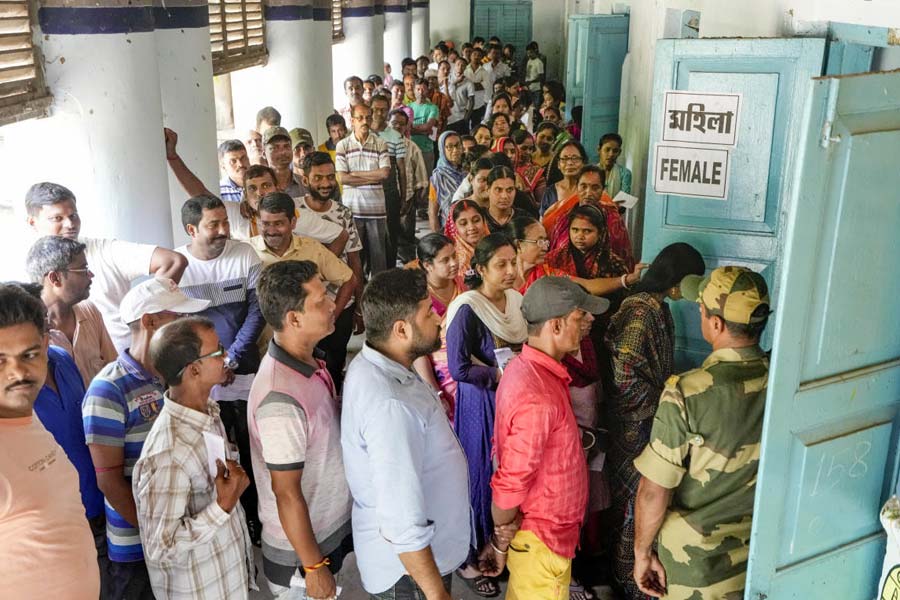
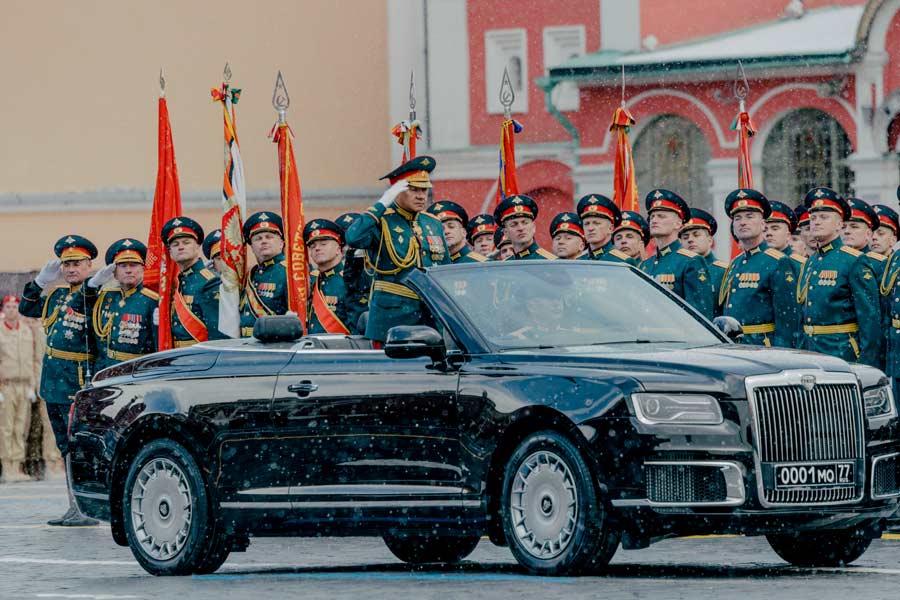
Rather than zooming into this fleeting moment of two months, an imaginary zooming out might allow us to see these elections and their ramifications in the context of the recent past and the near future
RUCHIR JOSHI
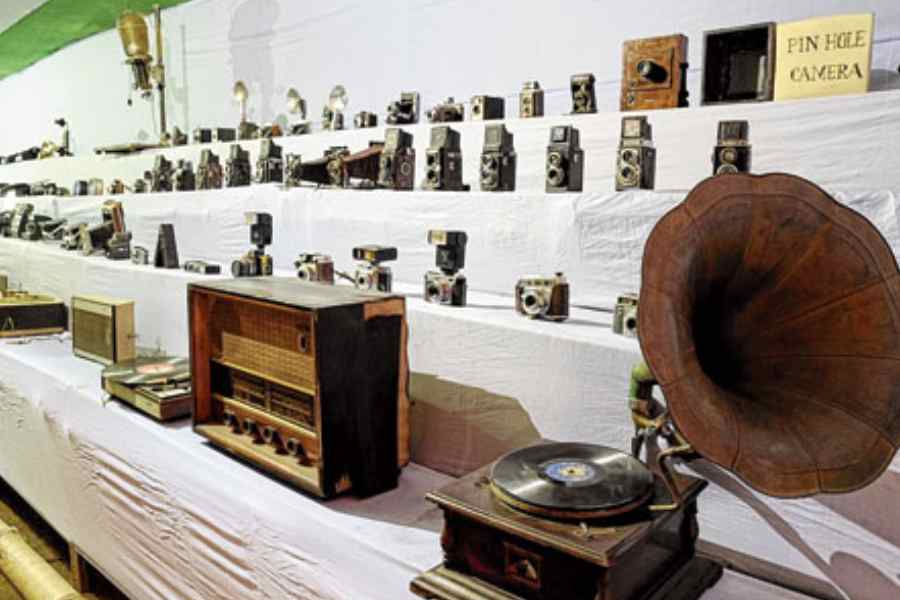
The first Indian recording made commercially in Calcutta took place on Nov 8, 1902. The singers were two nautch girls, Sashi Mukhi & Feni Bala, from Amarendra Nath Dutta’s Classic Theatre
MOUSUMI ROY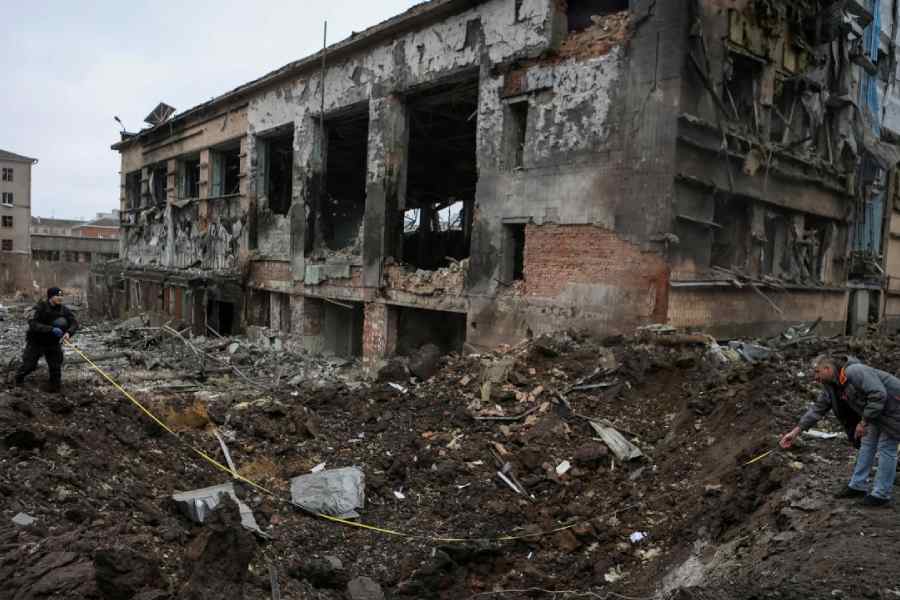
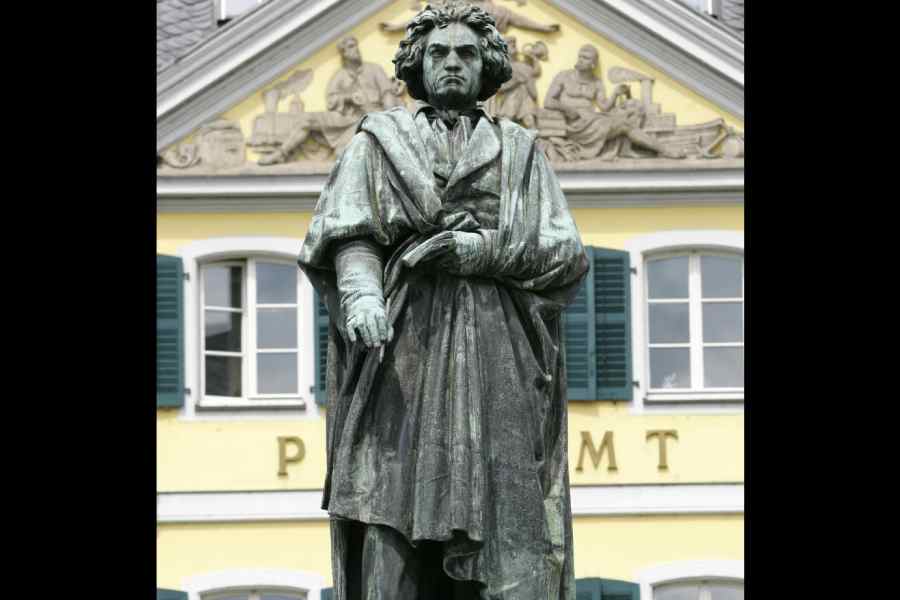
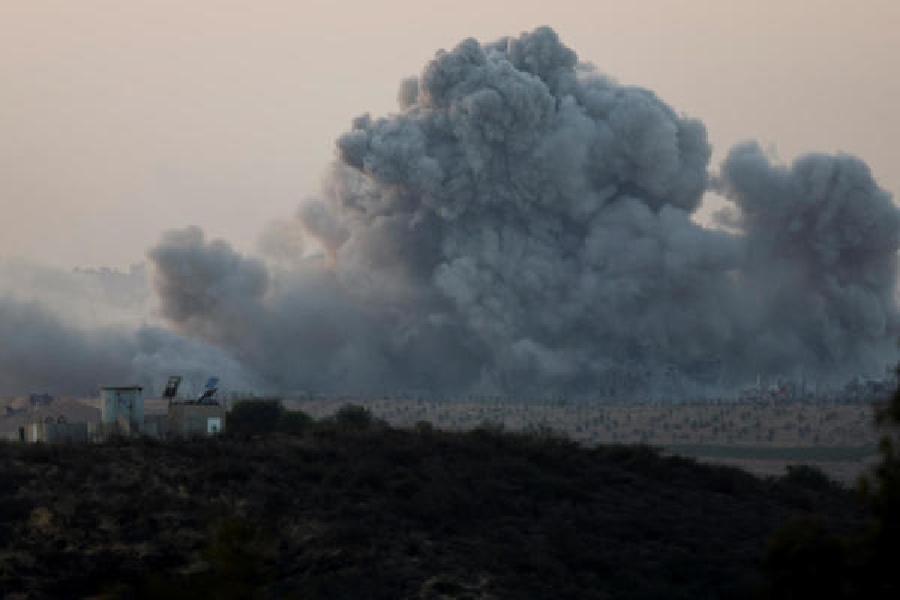
Kissinger argued that inherently unpredictable military applications of AI might eventually undermine even the minimal strategic stability of nuclear deterrence among the US, China and Russia
TIMOTHY GARTON ASH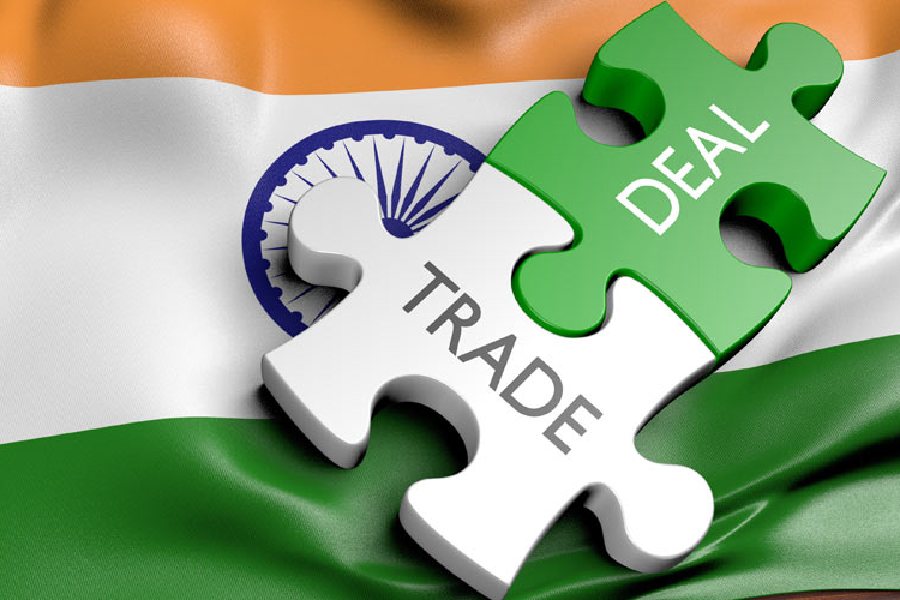
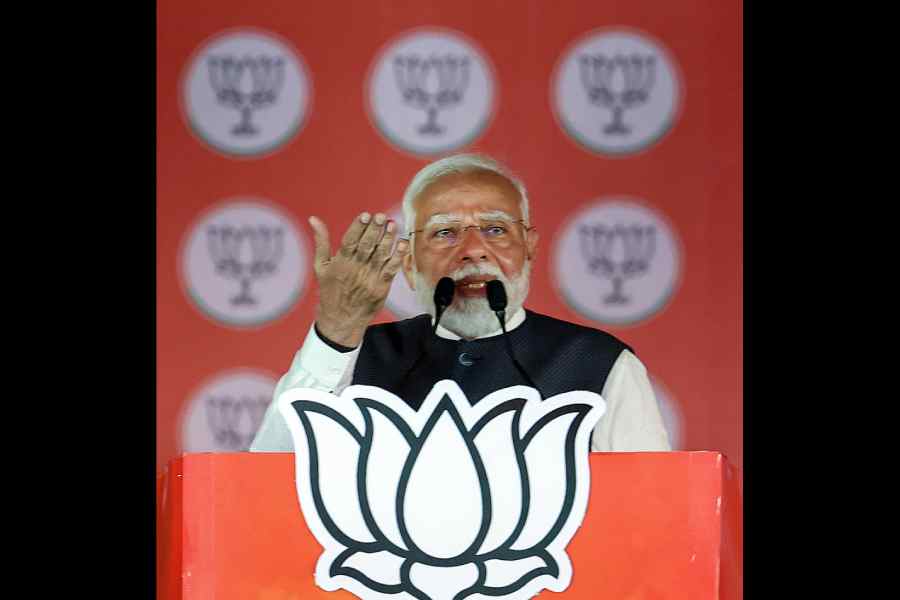
An FTA with the United Kingdom is in the works; once implemented, the UK-India FTA will be the first such free trade agreement that India would have with a major Western power
PRANAY SHOME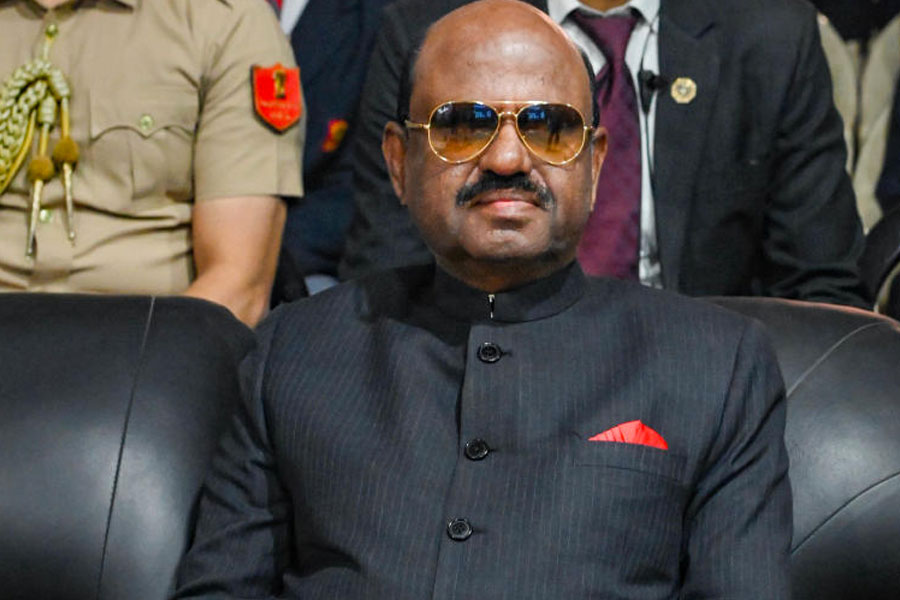
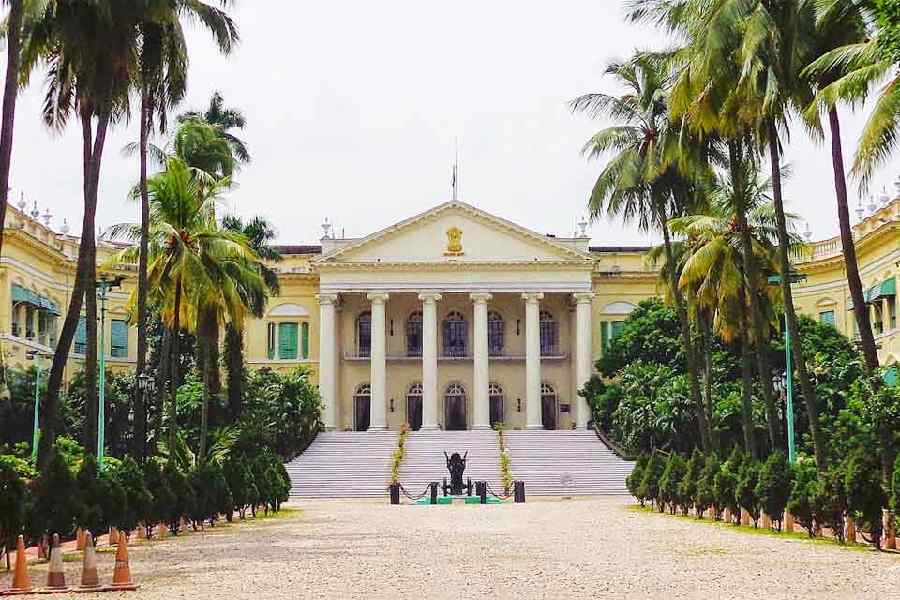
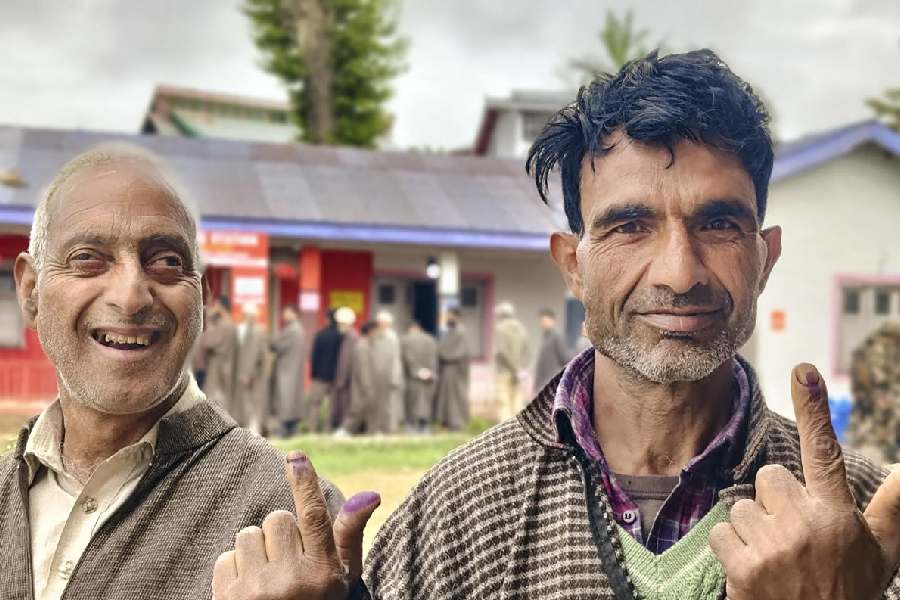
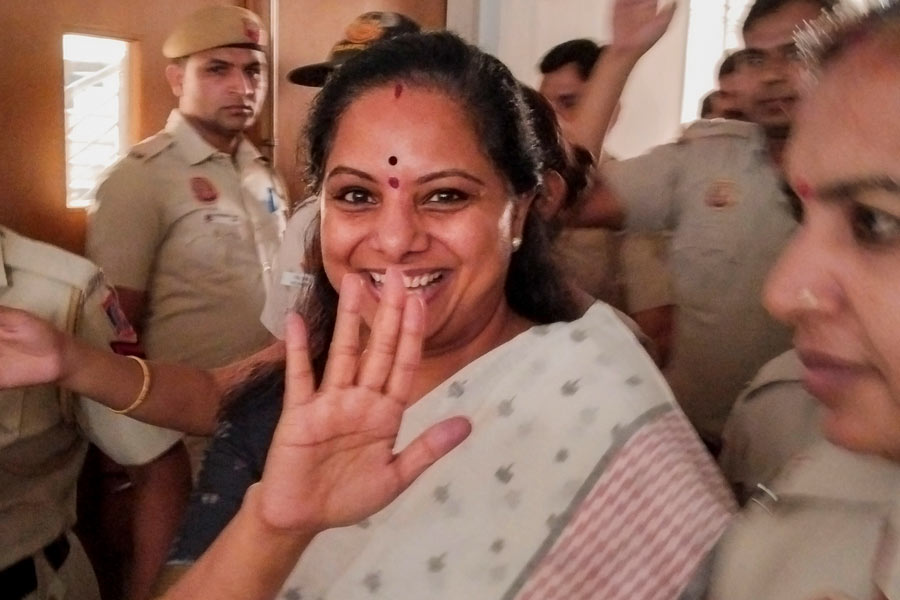
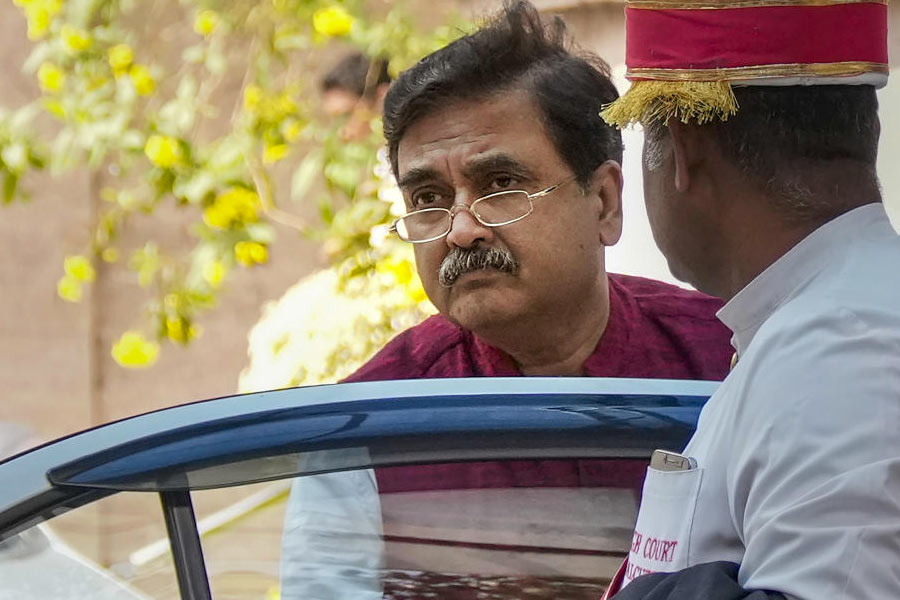
If it is a political conspiracy, as the governor claims, it would be easiest to dispose of it by exposing the falsehoods. But his actions have added fuel to the chief minister’s attacks against him
THE EDITORIAL BOARD


The episode featured Manisha Koirala, Sonakshi Sinha, Aditi Rao Hydari, Sharmin Segal, Sanjeeda Shaikh and Richa Chadha