

Art is a profound reality check. In creating an art object, the artist invites all of us to experience life without being attached to our conditioned understandings
T.M. KRISHNA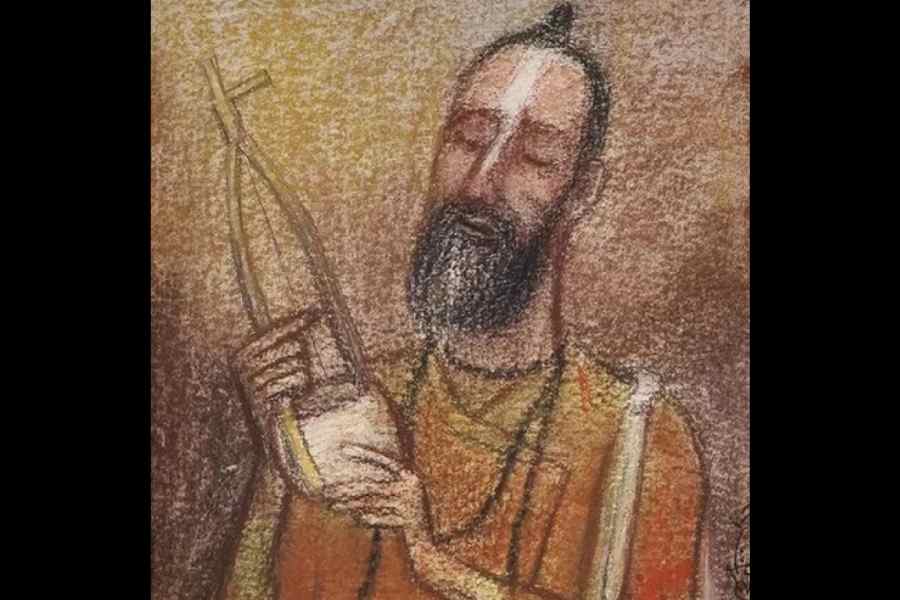
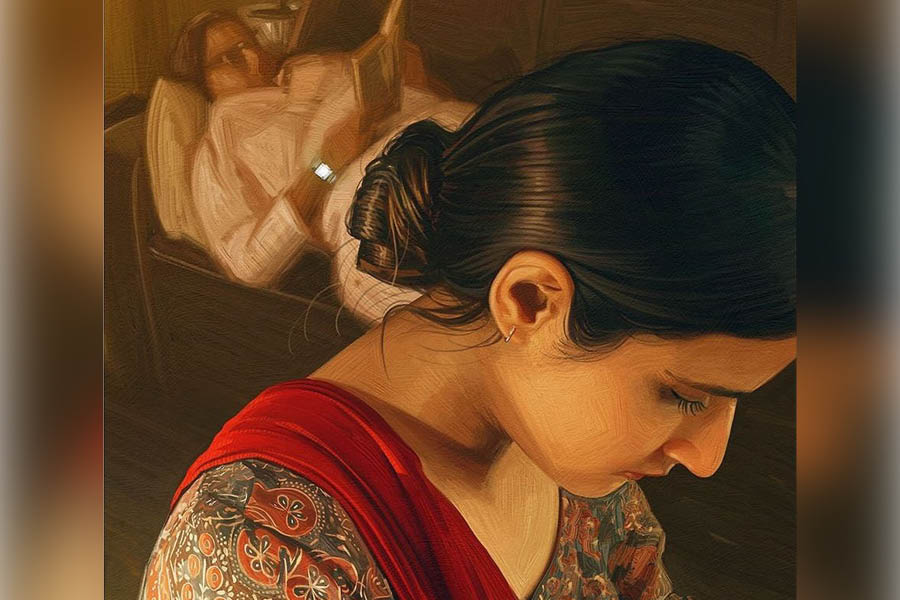
Bengali does not have one ‘single’ word for them, although they are variously described as unmarried, widowed, separated or divorced. Nor does Hindi. Not that they need new descriptions
CHANDRIMA S. BHATTACHARYA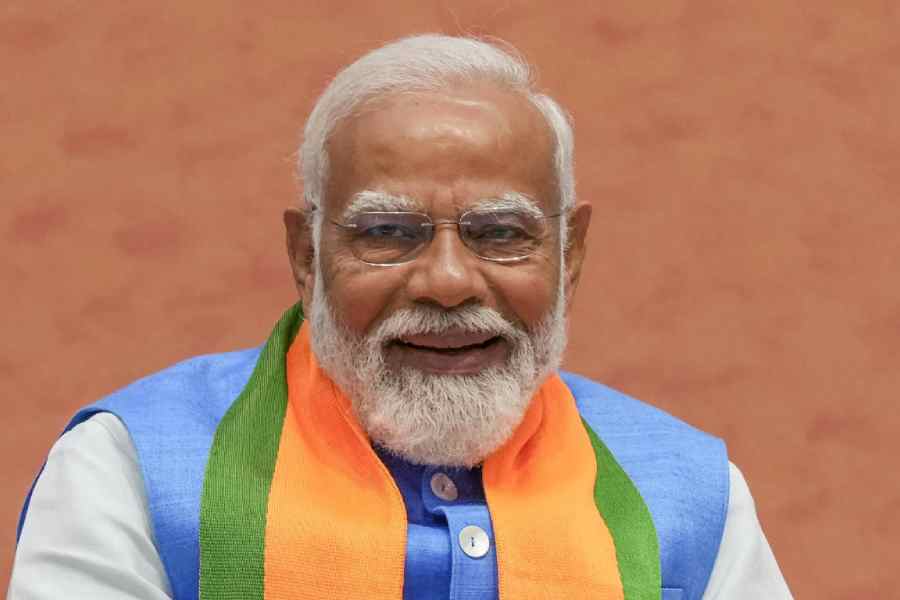
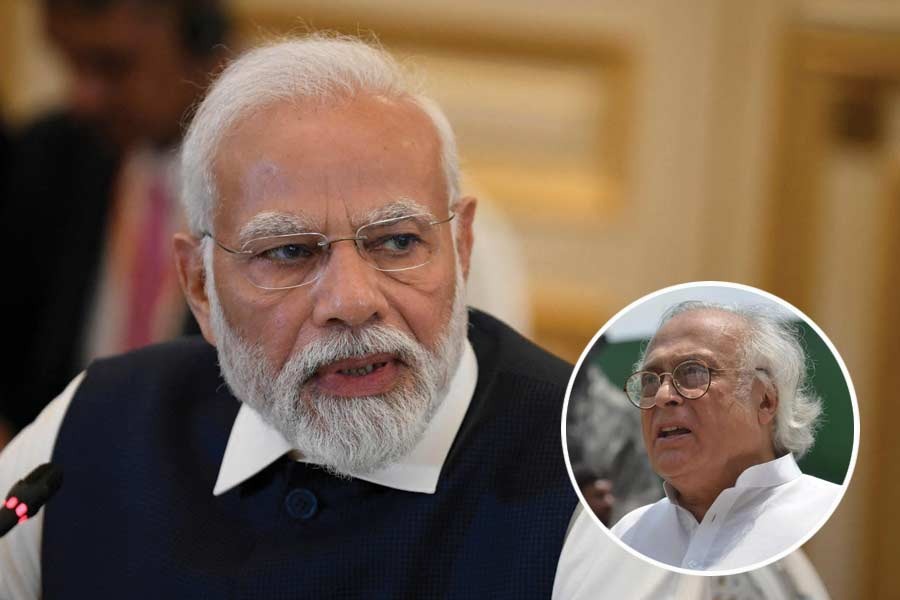
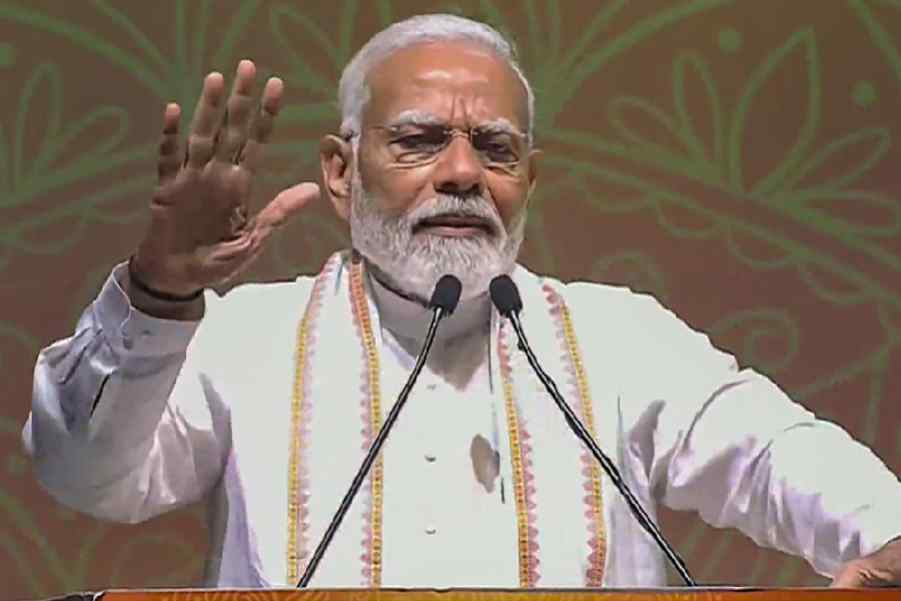
For the man who plays minder to Rahul Gandhi on his overseas visits, the Western media coverage seemed to imply that Modi had lost the plot and was on the cusp of being perceived as a global pariah
SWAPAN DASGUPTA
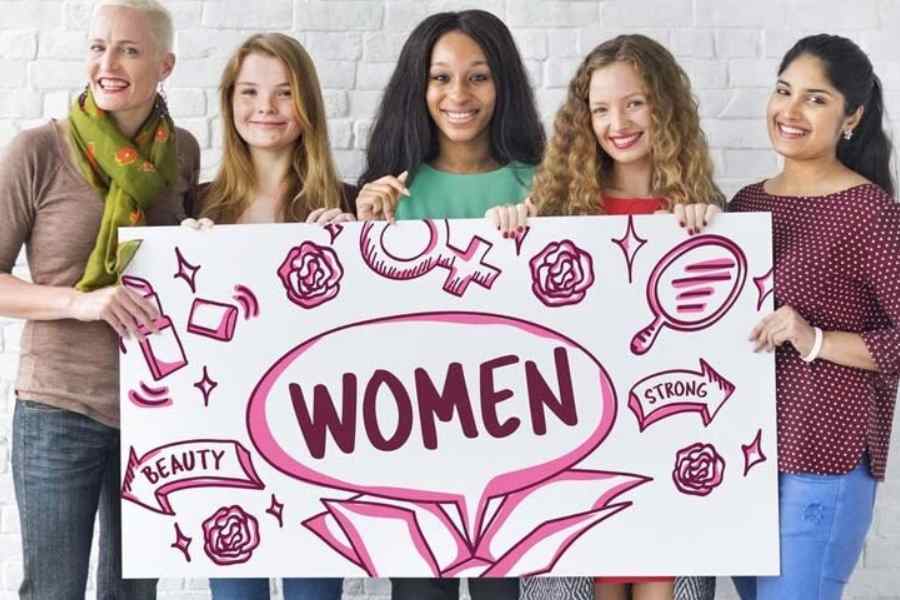
The fact that ‘working’ is as fluid a concept as gender needs to be focused in policymaking. This is because ‘work’ cannot be segregated in binary terms — private/public
SANHITA CHATTERJEE
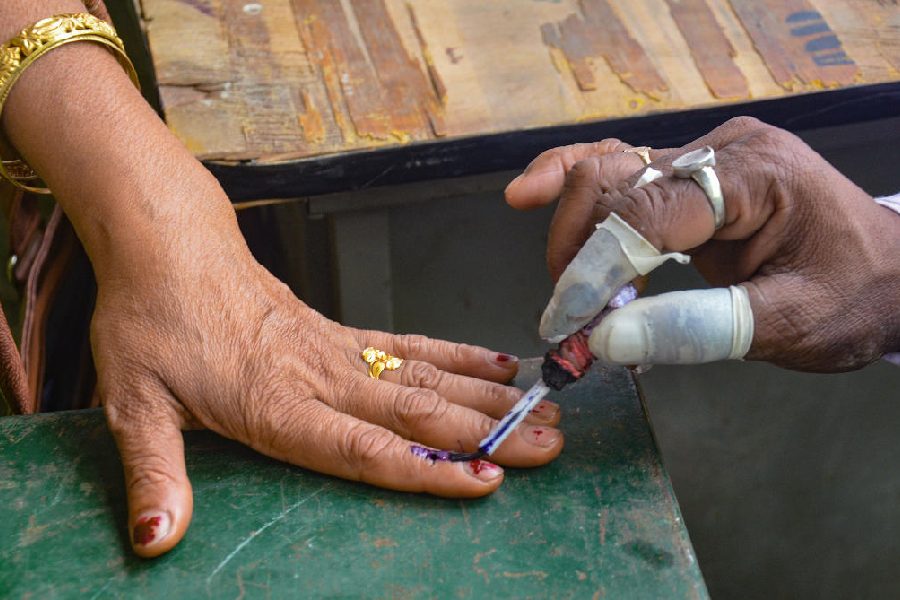
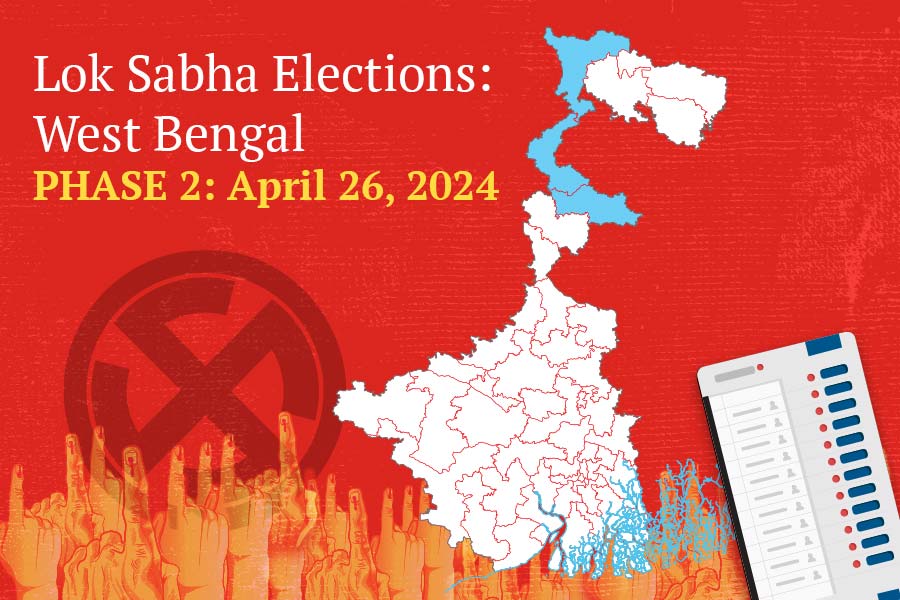
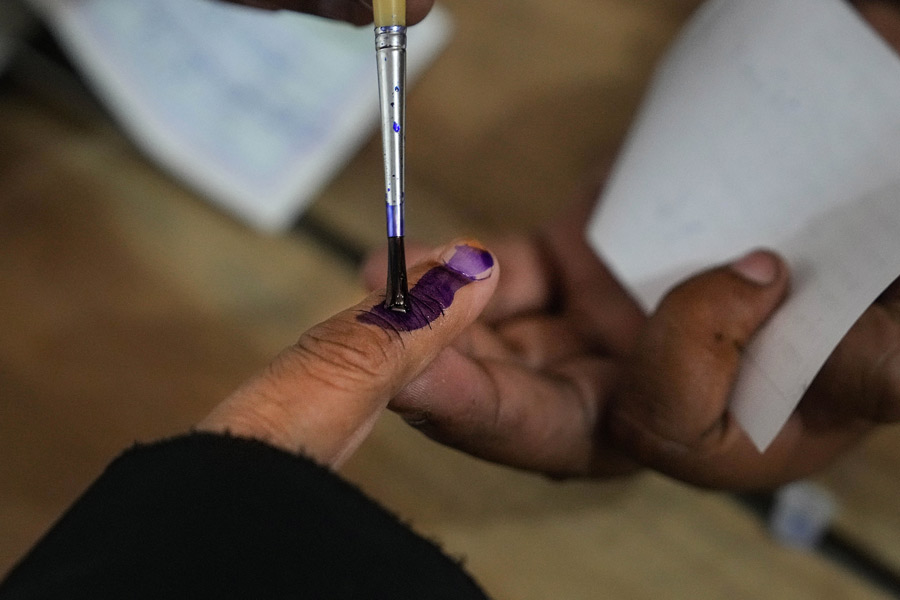
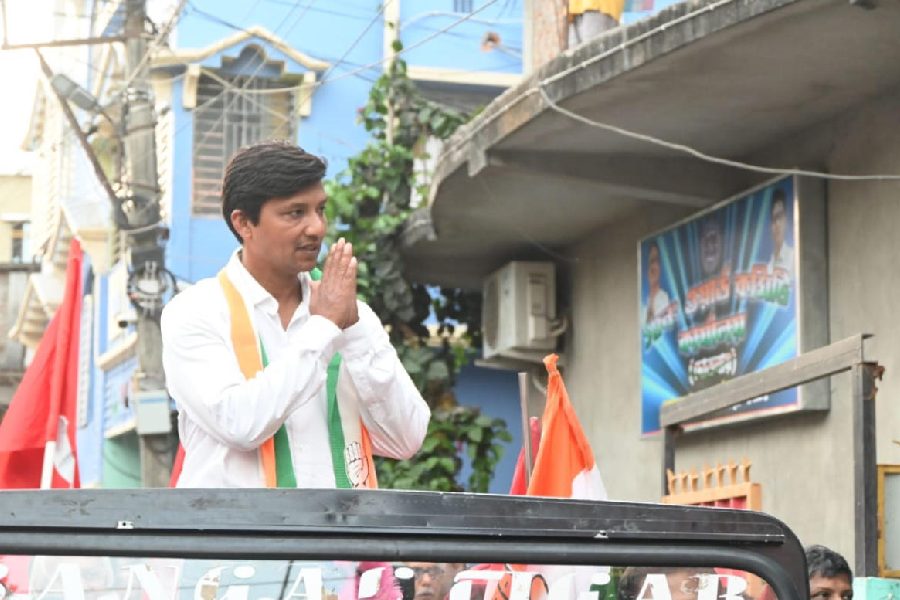
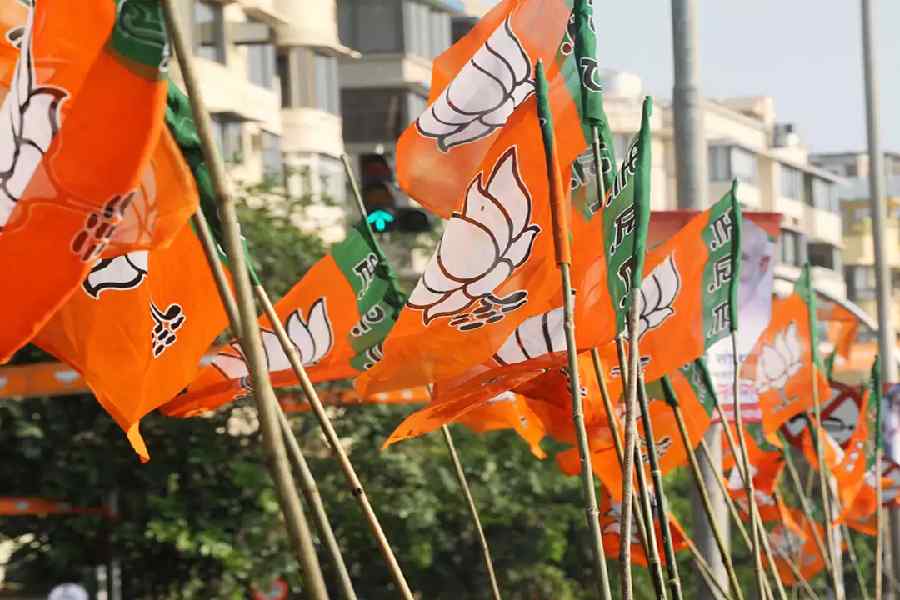
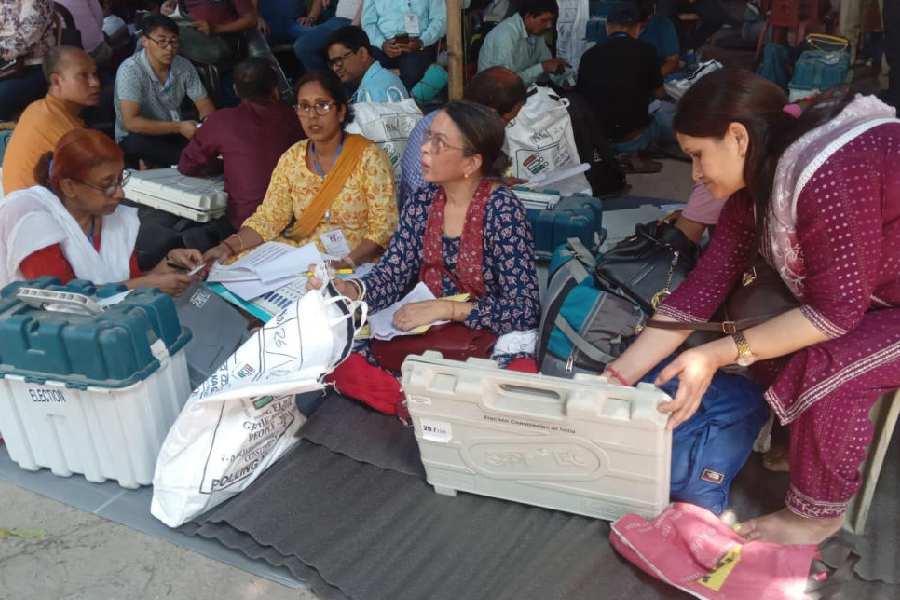
Weaponisation of falsehood, malicious use of deflection to thwart reflection, contamination of truth — each of these elements is in play in elections in India & around the world
THE EDITORIAL BOARD


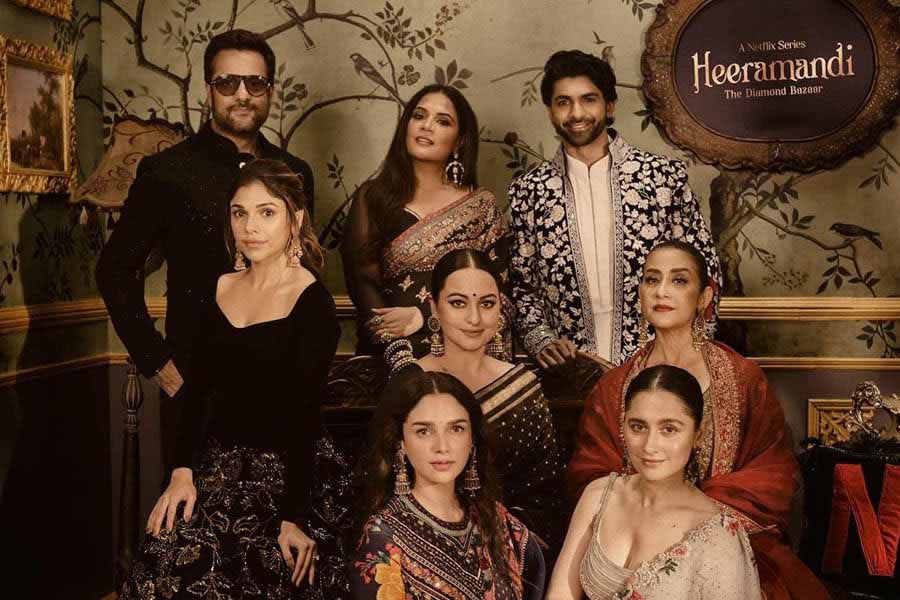
The upcoming project will premiere on Amazon Audible in late 2025